Massachusetts is well known as one of the most Democratic states in the country. There was no doubt that it would vote for Hillary Clinton in the 2016 presidential election – the only question was by what margin. The Democratic candidate’s margin of victory in Massachusetts had not changed a lot in the previous three presidential elections – it went Democratic by 25 points in 2004, 26 points in 2008, and 23 points in 2012. Massachusetts ended up being one of the twelve states where Hillary received a larger margin of victory in 2016 than Obama did in 2012 – she won it by 27 points. At the same time, Massachusetts held a referendum on whether or not to legalize recreational marijuana (medical marijuana had already been legalized in 2012 by a 63-37 margin). The marijuana referendum was substantially closer than the presidential election, but the state still voted to legalize recreational marijuana by a 7-point margin.
But why did Massachusetts swing more Democratic in 2016 (especially while every other New England state swung more Republican)? And what can we conclude about its electorate based on the results of the presidential election and marijuana referendum? For answers to these questions, plus more analysis and lots of maps, read on.
Presidential Election
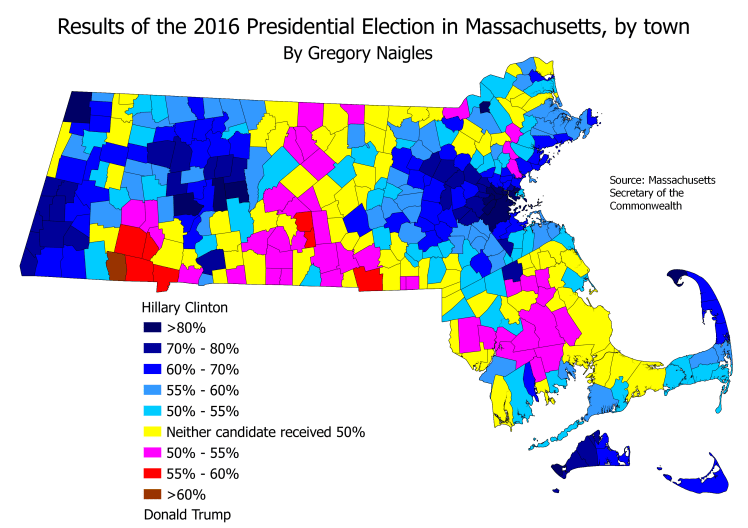
Initially, the fact that Massachusetts swung more Democratic in the 2016 presidential election might seem surprising. Massachusetts has a large white working-class population, a demographic that swung heavily toward Trump pretty much everywhere in the country. And while Massachusetts has more than its share of wealthy suburban towns (i.e. the sort of places that swung toward Hillary elsewhere in the country), so does Connecticut, and Connecticut still swung Republican in 2016.
So what gives? Why did Massachusetts swing Democratic in 2016 while Connecticut, a demographically similar state, did not?
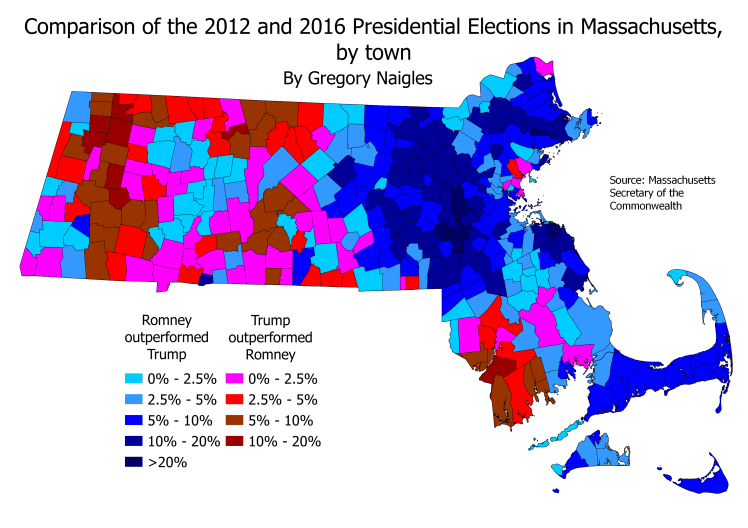
The best explanation is that, in many parts of the state, Obama’s numbers in 2012 were artificially deflated due to the presence of Mitt Romney, the former Governor of Massachusetts, on the ballot. As the map shows, Trump vastly underperformed Romney in precisely the sorts of wealthy suburban towns where Romney outperformed the normal Republican baseline in 2012, such as Weston (the richest town in Massachusetts) and several other rich towns south of it. But Romney overperformed, and Trump underperformed, in wealthy towns almost everywhere in the country. However, as the map shows, Trump also underperformed Romney by large margins in most of the middle-class and upper-middle-class suburban towns in Massachusetts, all the way out to Worcester County. Romney’s overperformance in those types of towns in 2012 was mostly unique to Massachusetts, which is why Trump’s massive underperformance of Romney in these types of towns in 2016 was also mostly unique to Massachusetts. This is particularly true for towns in Essex and Norfolk counties, and on Cape Cod.
County-level maps show Trump outperforming Romney in the entire western half of Massachusetts. But looking at the results from a town-level perspective shows that that was not the case. Hillary held her own in the very liberal Northampton-Amherst area, and gained in a few Springfield suburbs (most notably Longmeadow, which is considerably richer than the other Springfield suburbs). She also mostly held her own in the westernmost towns in the state, along the border with New York. Her major losses came in a row of towns in eastern Berkshire County, where Trump massively outperformed the Republican baseline. Why did Trump do so well there? Those towns are far enough away from the Pioneer Valley (the valley of the Connecticut River), whose populace is highly educated. However, they are not touristy (like the towns in southwestern Berkshire County), nor do they have any colleges or universities (like Williamstown, in the far northwest corner of Massachusetts, does). Thus, those towns (the largest of which are North Adams and Adams) have proportionally more white working-class voters than the towns to the west or east. Trump also performed well in the economically depressed southern half of Bristol County, including the cities of Fall River and New Bedford, as well as in other working-class white enclaves across the state such as Saugus.
Marijuana Referendum
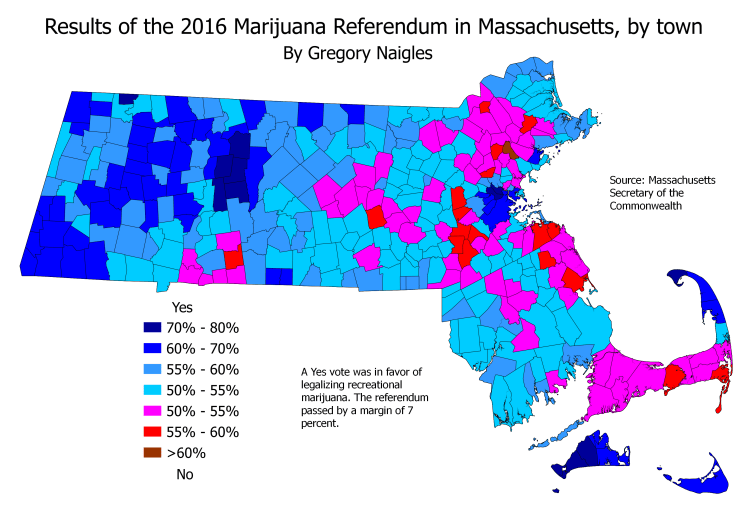
Massachusetts’ 2016 referendum to legalize recreational marijuana passed by a 7-point margin. A common pattern in marijuana referendums is for both normally-Republican and normally-Democratic towns to be more closely divided on marijuana than they are normally (we saw this same pattern in Maine’s 2016 referendum as well). Only 12 towns voted more than 70 percent to legalize marijuana (compared to 44 towns that gave Hillary more than 70 percent), and only a single town (Lynnfield) voted more than 60 percent against. Support for legalizing marijuana seemed to be concentrated in a few areas in Massachusetts: the Amherst-Northampton area (home to the Five Colleges), Western Massachusetts more generally (except for the Springfield suburbs), Boston and its inner suburbs (but not its middle-ring or outer-ring suburbs), the tip of Cape Cod, and Martha’s Vineyard and Nantucket.
What do these areas all have in common? Well, for one, they are all heavily Democratic. But there are plenty of other places in Massachusetts that are also heavily Democratic, and that did not support legalizing recreational marijuana. Many of these heavily Democratic towns that were more closely divided on marijuana have large African-American or Hispanic populations. Places like Springfield, Worcester, Lowell, Lawrence, Chelsea, and Brockton fall into this category. However, interestingly, the African-American and Hispanic areas of Boston nonetheless voted over 60 percent to legalize marijuana (the only area of Boston that didn’t was West Roxbury).
Some of the other Democratic towns that that had much less support for legalizing marijuana were rich suburban towns. If you look at the second map above (the one that compares the 2012 and 2016 presidential results), you’ll see that the row of dark blue towns west of Boston (i.e. the towns that swung very strongly toward Hillary, due to their wealth and level of education) line up quite nicely with the row of red towns west of Boston on the marijuana referendum map. The clear implication of this is that marijuana is much less popular in these rich, highly educated suburban towns.
Furthermore, there’s the aforementioned trend for marijuana to underperform Democrats in Democratic towns, and to outperform Democrats in Republican towns. This is because marijuana is less of a partisan issue than most others, and a lot of Republicans support legalizing it and a lot of Democrats oppose legalizing it.
All this should be a good explanation for this map:
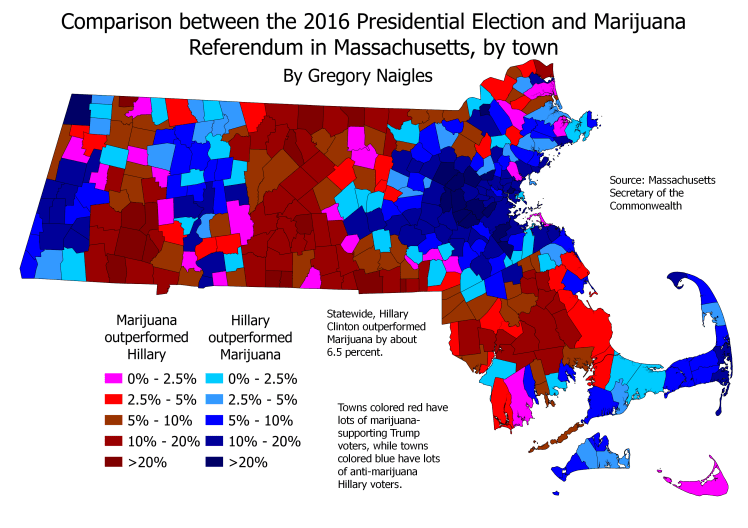
In brief, Hillary outperformed marijuana in towns that either 1) are very Democratic, 2) are rich and/or highly educated, 3) have large minority populations, or 4) are some combination of the above. Marijuana outperformed Hillary in most white working-class suburbs and rural areas.
Finally, I’ve got one more map to present. As I mentioned earlier, Massachusetts also had a referendum in 2012 that legalized medical marijuana. Statewide, medical marijuana in 2012 outperformed recreational marijuana in 2016 by about 10 percent and in all but two towns in Massachusetts. But, as the map below shows, not everywhere had the same difference in support between medical and recreational marijuana:
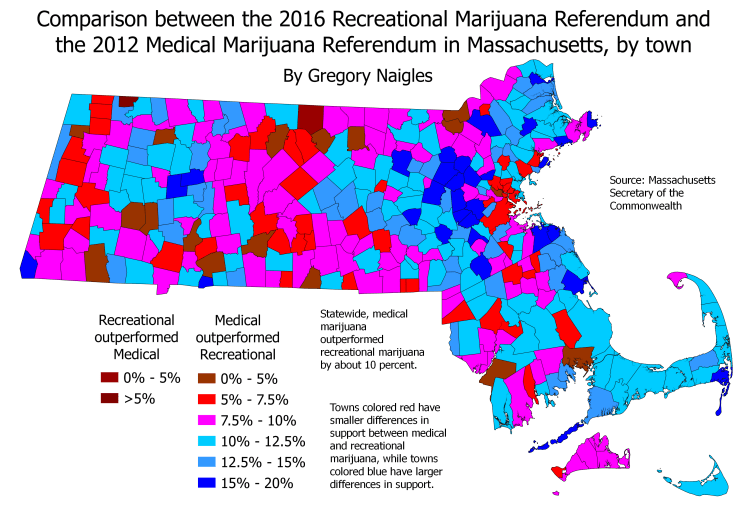
It may seem difficult at first to draw any conclusions from this map, but there are several notable patterns. First, most of the major cities, and most of the towns with large minority populations, saw medical marijuana outperform recreational marijuana by a smaller margin than the state as a whole (and thus they are colored in red on the map). People in those towns most likely see the two issues as very similar. However, many of Boston’s rich, highly-educated suburbs (plus the rich Springfield suburb of Longmeadow) saw medical marijuana outperform recreational marijuana by a large margin, indicating that residents of those towns draw a sharp distinction between the two. Thus, while many proponents of recreational marijuana see medical marijuana as just a stepping stone toward legalization of recreational marijuana, it is clear that many wealthy, highly-educated suburbanites don’t see it that way. Working-class white voters seem to have similar views toward medical and recreational marijuana at a slightly higher rate than the state as a whole.
Stay tuned for my next articles analyzing the 2016 election results – Vermont and New Jersey!
