Due to an extremely busy summer, I haven’t been able to write any articles for a while. But I’ve still been making maps, so I wanted to give a rundown of the maps that I’ve made during the summer and early fall.
Connecticut
Connecticut’s primary was August 14. The important nominations that were decided were both parties’ gubernatorial and LG nominees, as well as the nominees for the open 5th congressional district.
First up, Ned Lamont defeated Joe Ganim in a massive 81-19 landslide to win the Democratic gubernatorial nomination.
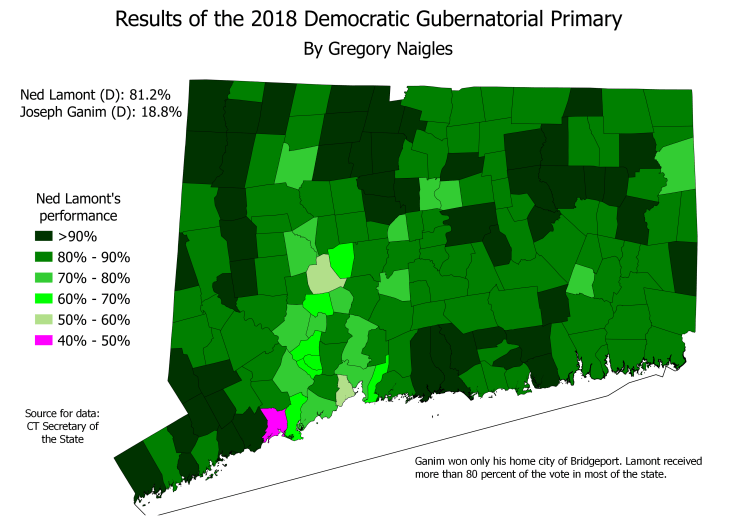
Ganim won only his hometown of Bridgeport, while Lamont received more than 90 percent in dozens of towns. The only other part of the state where Ganim did better than his statewide average was the Naugatuck Valley, where many former Bridgeporters who remember Ganim have subsequently moved. Lamont performed especially well in the wealthier towns in the state, whose residents had no tolerance for Ganim’s corruption.
At the same time, Lamont’s unofficial running mate Susan Bysiewicz defeated Eva Zimmerman for the Lieutenant Governor nomination, but this was quite a bit closer.
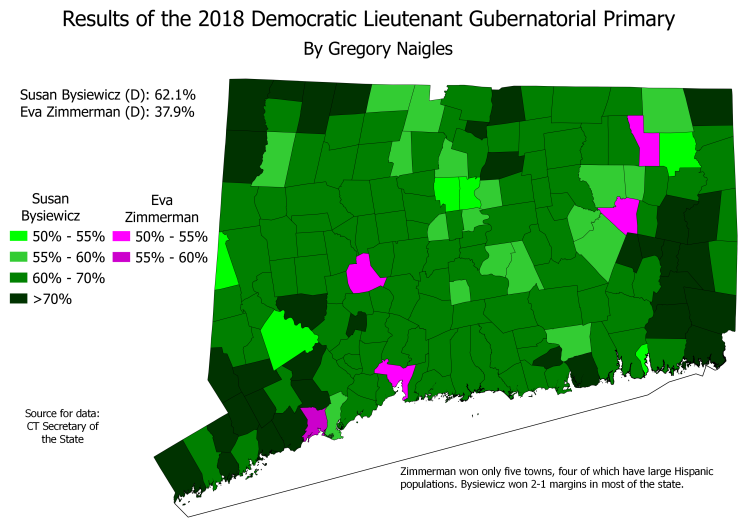
Bysiewicz defeated Zimmerman 62-38, and won all but 5 towns in the state. Four of those five towns have large Hispanic populations, and three are major cities. But Zimmerman was unable to expand her support outside of those cities, and Bysiewicz won most of the suburbs and rural areas by approximately 2-1 margins.
In CT-05, former Teacher of the Year Jahana Hayes defeated Simsbury First Selectwoman Mary Glassman by a 62-38 margin for the Democratic nomination.
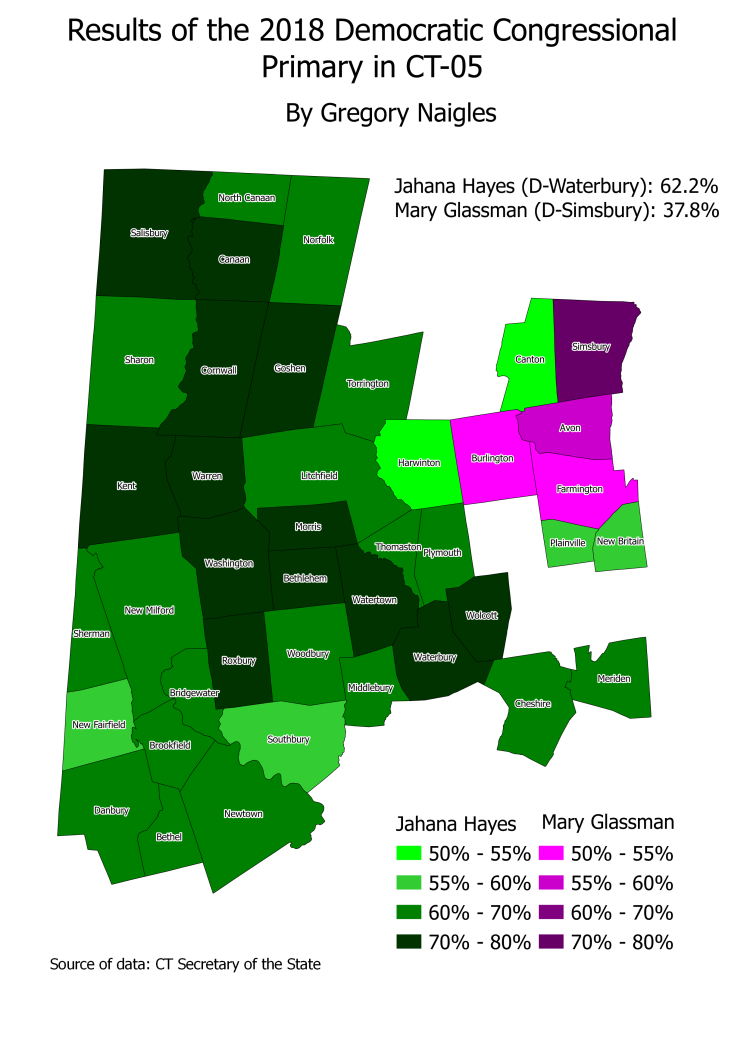
Glassman won only her hometown of Simsbury and three nearby (and demographically similar) towns. Hayes won landslide margins almost everywhere else. Hayes was particularly strong in Waterbury (where she grew up and where she teaches) and in the rural towns in the Litchfield Hills, where the Democrats are very liberal (Ned Lamont won these towns in landslides in his 2006 U.S. Senate primary against Lieberman). Hayes now moves on to face former Meriden mayor Manny Santos (R) in the general election; Hayes is favored due to the national environment and the fact that the district leans Democratic.
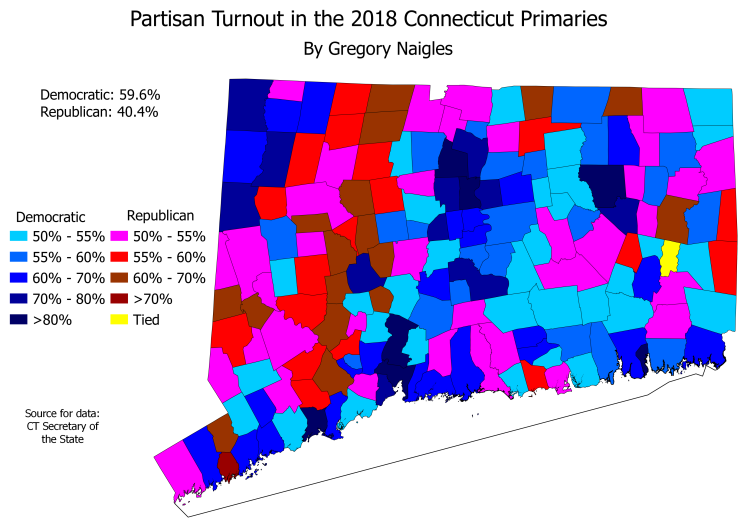
This last Connecticut map shows the partisan composition of the 2018 primaries. Keep in mind that Connecticut has closed primaries, so this map is largely a reflection of voter registration patterns.
Massachusetts
Massachusetts held its primary on September 4, the day after Labor Day. With the statewide elections this year expected to be sleepy affairs (Governor Charlie Baker and U.S. Senator Elizabeth Warren are both favored to win in landslides), the hottest race this year was the MA-07 Democratic primary, where incumbent Mike Capuano ended up being defeated by a 59-41 margin by Boston City Councillor Ayanna Pressley.
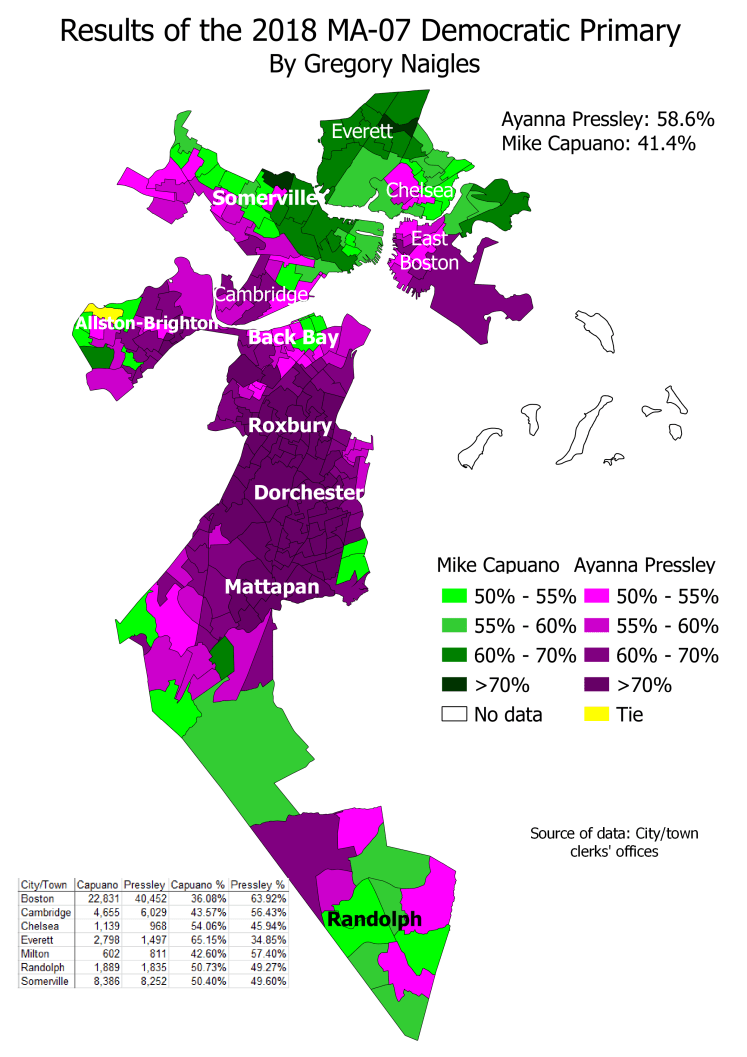
Capuano did well in working-class Everett, but was unable to hold onto his previous base in his gentrifying hometown of Somerville (which he only barely won). Meanwhile, Pressley crushed it in the minority-heavy neighborhoods of Boston, and even won some mostly-white areas such as Jamaica Plain and Allston.
An important factor in Pressley’s defeat of Capuano was that turnout was much higher there than in past Democratic primaries, and that Pressley brought out voters who didn’t usually vote in primaries. But that wasn’t a one-way street. I made a map that compares turnout in the 2018 primary with turnout in the 2016 presidential primary.
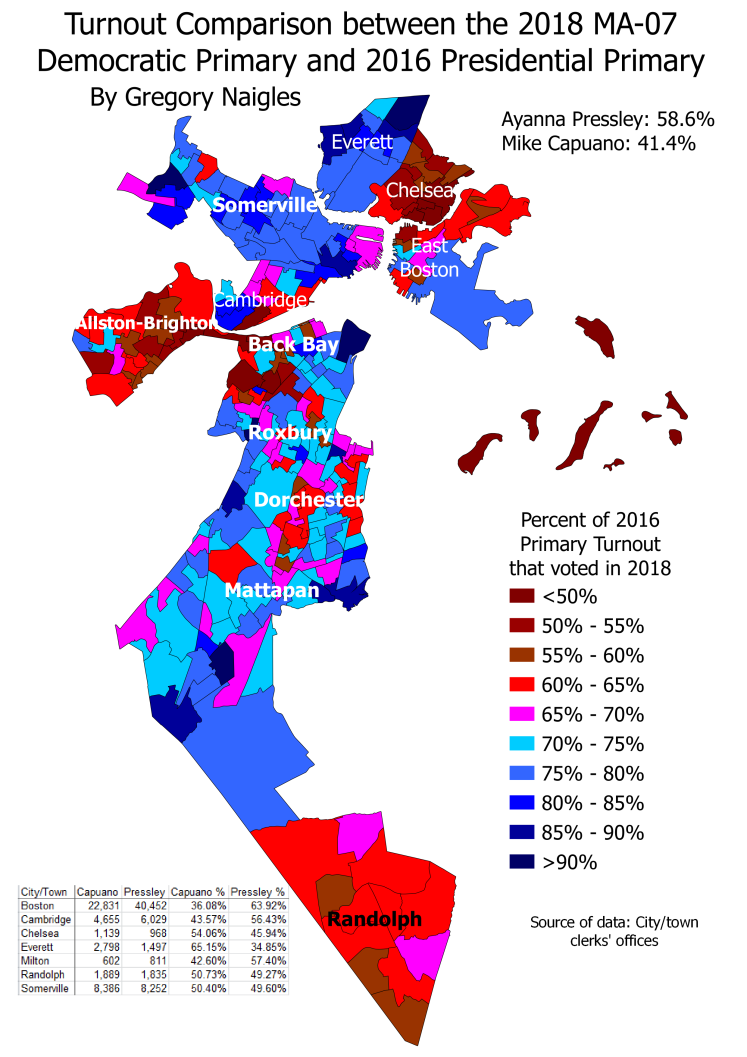
The places with the highest comparative turnout in 2018 were Somerville (which Capuano won but did worse than expected in) and Everett, which Capuano won by a wide margin. Pressley’s base in Roxbury, Dorchester, and Mattapan did not turn out at significantly higher rates than the remainder of the district, and neighborhoods such as Allston, where Pressley did well, actually turned out at lower rates. This goes to show that turnout is just one part of how Pressley beat Capuano – she also convinced a large number of reliable primary voters, who had voted for Capuano in previous years, to vote for her.
This next map shows the partisan composition of Massachusetts’ 2018 primaries.
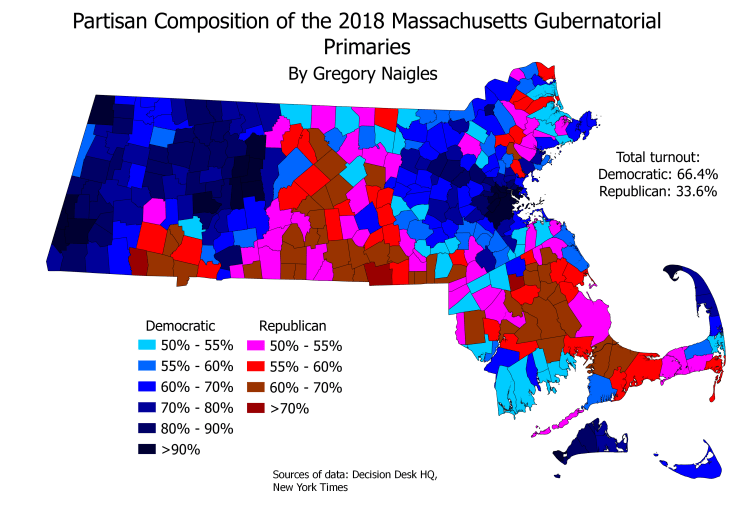
Approximately twice as many Democrats as Republicans turned out, however Republicans still won wide swaths of the state. This is partly because some towns were so one-sidedly Democratic in their voting, that I actually had to add a new, darker shade of blue to my normal color scheme. In places like Boston, Cambridge, Somerville, Northampton, and Amherst, more than 90 percent of voters cast Democratic ballots.
But how does this map compare to the 2016 presidential election results? Luckily, I made a map for that too.
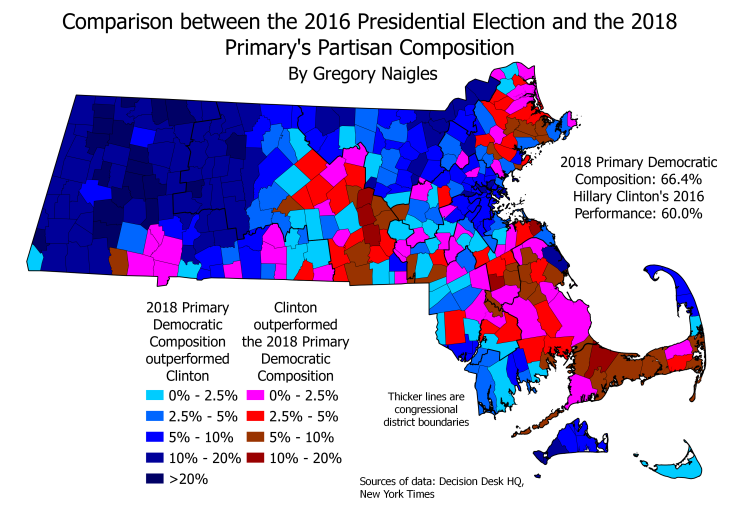
In rural western Massachusetts, Democratic partisan composition vastly outperformed Clinton. This is partly due to Clinton’s weak performance in that part of the state, and partly due to rural liberals being fired up to vote this year. Democratic partisan composition also outperformed Clinton in every town in MA-03 (Lowell & Lawrence areas) due to the competitive congressional primary happening there. Some outer suburbs of Boston in Essex, Worcester, and Plymouth counties that swung heavily to Clinton in 2016 saw a bit of a bounce-back this year, due partly to strong support for Massachusetts’ Republican governor Charlie Baker.
To demonstrate how fired up those rural liberals in western Massachusetts are to vote, I’ve made a map comparing the voter turnout in the 2016 and 2018 primaries. This is basically a statewide and town-level version of the map that I made for MA-07 above.
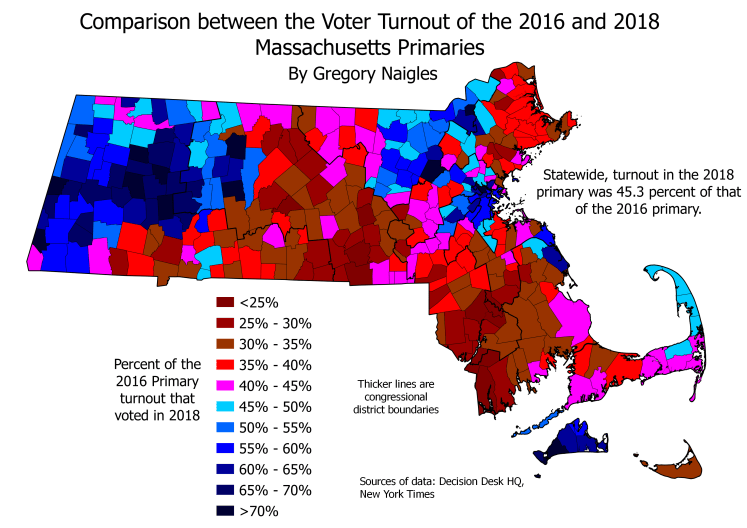
The rural liberals in western Massachusetts really stick out on this map, as does MA-03, and MA-07 in the Boston area. Most of the rest of the state saw lower-than-average turnout in 2018.
New Hampshire
New Hampshire held its primaries on September 11. The major contested primaries were the Democratic gubernatorial primary, both parties’ 1st congressional district primaries, and the Republican primary for the 2nd district. The most high-profile of these primaries was the NH-01 Democratic primary, which was won by Executive Councillor Chris Pappas.
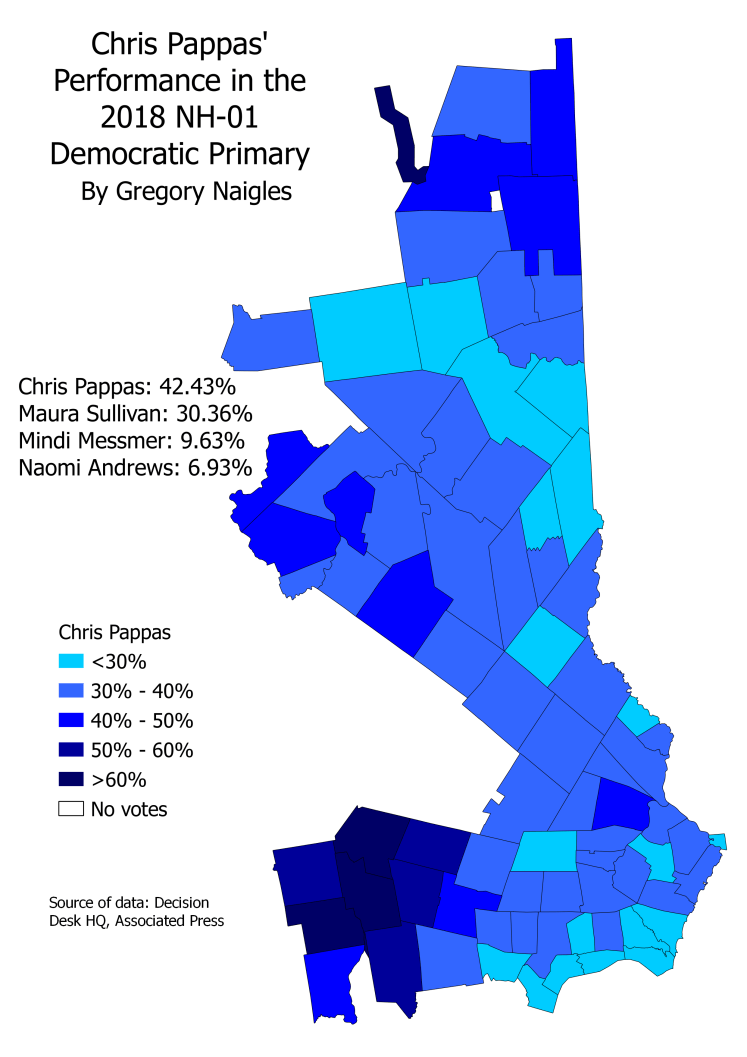
Pappas received solid pluralities in most of the district, but most of his margin of victory came from his hometown of Manchester and the neighboring towns, which Pappas won in massive landslides. Manchester, which he won by a 66-20 margin, alone provided more than half of his margin of victory. He was weakest in the Seacoast region, where his main opponent Maura Sullivan won a bunch of towns, but he dropped below 20 percent in only one town, indicating broad support. The winner of the Republican primary was Eddie Edwards, who will now face Pappas in the general election. Pappas is favored, both due to the national environment and because Pappas, as an elected official with a track record of winning elections in Republican-leaning districts, is a stronger candidate than Edwards.
And the national environment certainly favors Democrats. In the primaries in NH-01, which is a swing district that narrowly voted for Trump, Democrats outvoted Republicans by a significant margin. And since New Hampshire has semi-open primaries (meaning that independents can vote in whichever primary they choose), this is a meaningful metric of voter excitement.
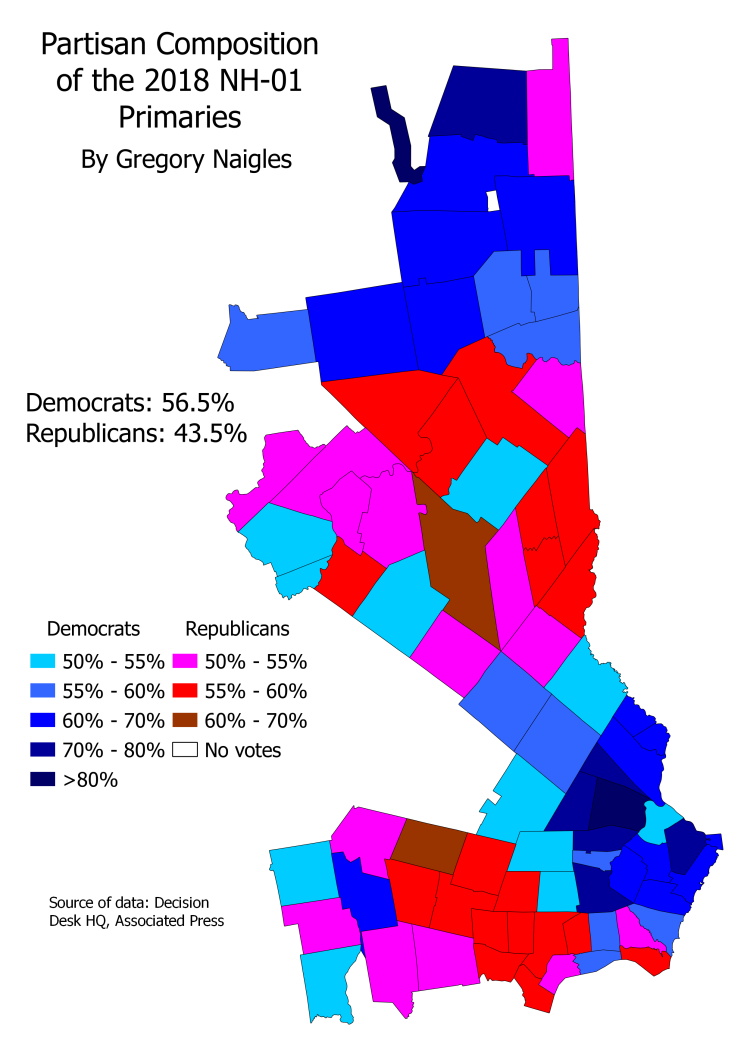
Democrats massively outvoted Republicans in all their strongholds in NH-01 – Portsmouth, Durham, Dover, and Exeter. But they also outvoted Republicans 62-38 in Manchester (which is normally 55-45 Democratic), and even outvoted Republicans in towns that Dems almost never win, such as Goffstown, Merrimack, and Wolfeboro.
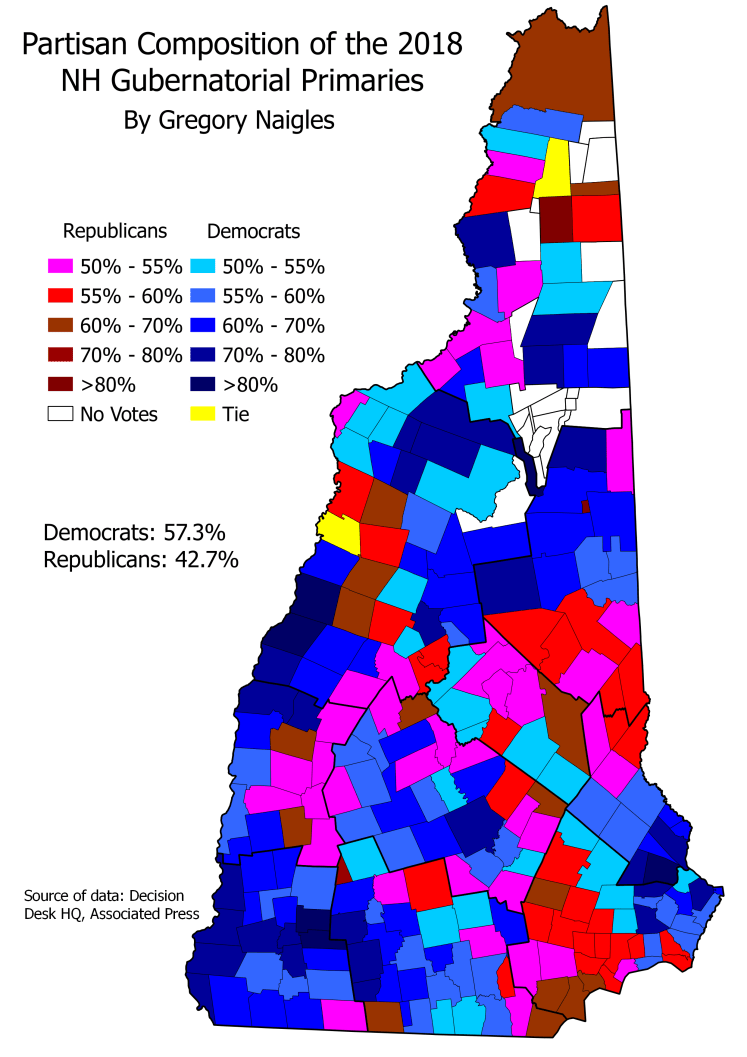
The partisan composition of the gubernatorial primaries was even better news for Democrats – they outvoted Republicans by a 57-43 margin.
To give an idea of just how big a win this would be for Democrats if a statewide election map looked like that, I’ve made a map comparing the partisan composition of the 2018 gubernatorial primaries to the 2016 presidential election results.
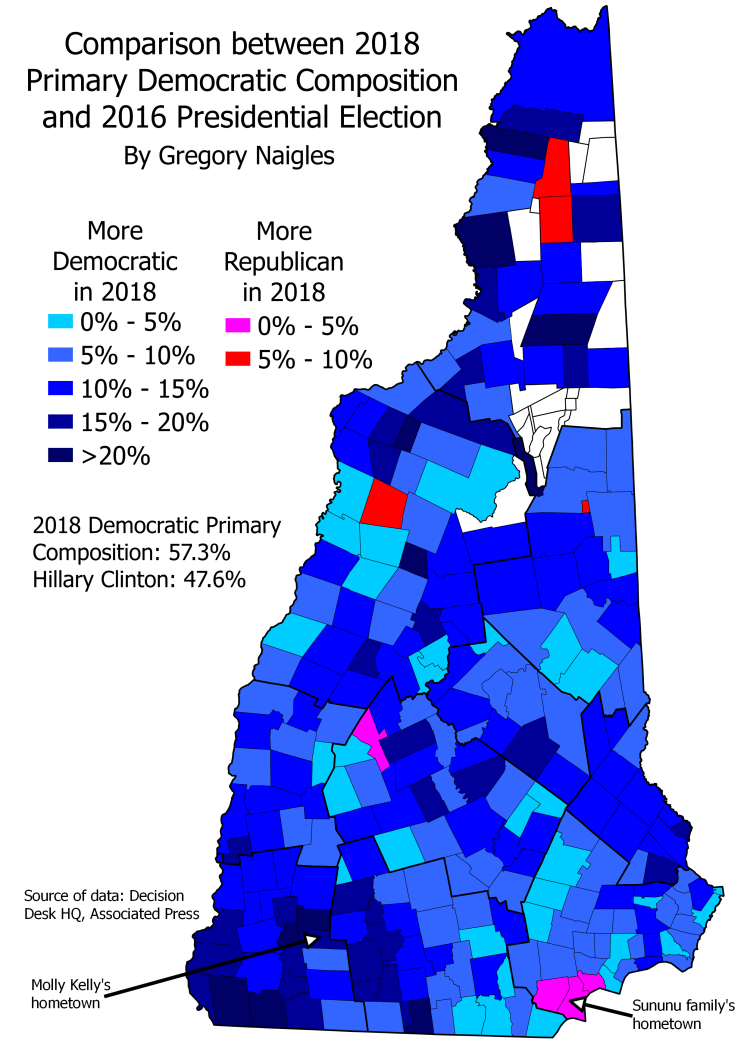
The map is pretty much a sea of blue, meaning that Democratic primary composition outperformed Clinton in 2016 almost everywhere. The only notable exception was the town of Salem, and two of its neighboring towns. Salem is the hometown of the Sununu family, so it makes sense that the Republicans there would be particularly excited to turn out for Chris Sununu. What should worry Chris Sununu is that hardly anyone else in the state felt that way.
Ohio
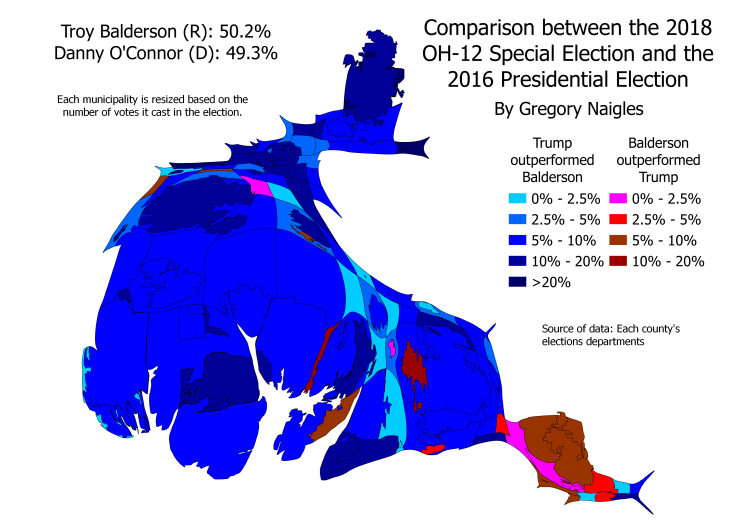
Ohio’s 12th congressional district held a hotly-contested special election this summer. The district, which is normally reliably Republican, gave Republican Troy Balderson a very narrow (less than 1 percent) victory over Democrat Danny O’Connor.
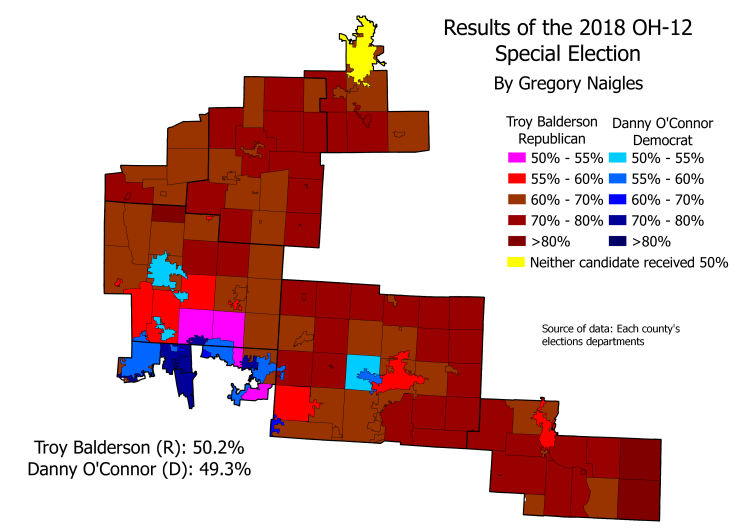
If you didn’t know the political geography of the district, you’d probably think that this was a big Republican win. However, a majority of the district’s population lives in Columbus and its suburbs, and despite Balderson winning the rural areas by landslides, O’Connor crushed it in both Columbus and in many of its normally-Republican suburbs, and improved dramatically on the Democratic baseline in the suburbs that he didn’t win.
To demonstrate where the population of the district actually lives, I’ve made a cartogram of the above map, with each municipality resized based on the number of voters there.
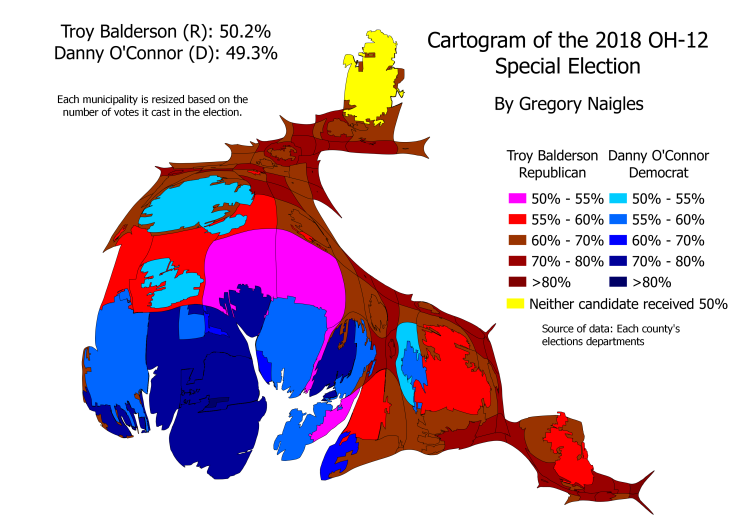
This shows better how many people live in Columbus and its suburbs, and how much impact they have on the elections here.
O’Connor improved dramatically on Clinton’s performance in 2016 – he lost only 50-49, while Trump won the district 53-42 in 2016. Where did O’Connor improve the most compared to Clinton?
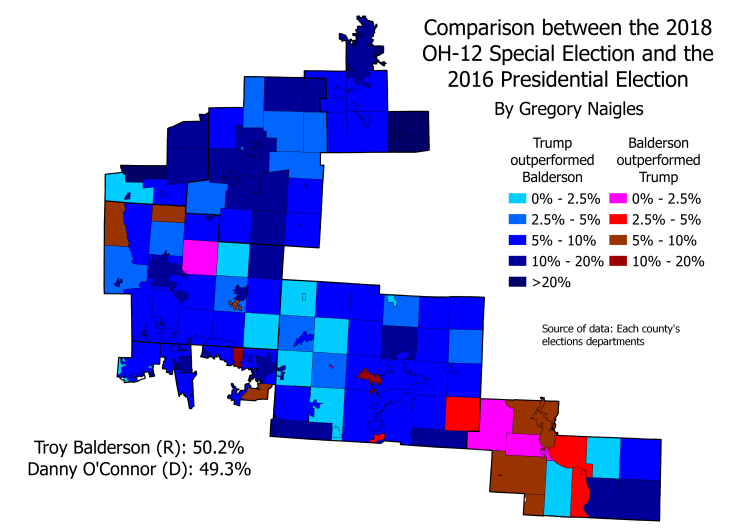
Most of the district actually saw a fairly uniform swing toward O’Connor. There were two major exceptions to this, however. The first was Muskingum County, home to Zanesville. Balderson is from Zanesville, and they turned out heavily for their native son, with the result that Balderson did even better there than Trump’s already strong performance in Muskingum. The second is the town of Granville, directly west of Newark in Licking County. Granville is a college town, home to Denison University, and it is much more Democratic than the rest of Licking County. However, because the special election was held over the summer, the students weren’t there, and thus they did not vote. This explains why Granville gave O’Connor a lower percentage of the vote than it gave Clinton.
The fact that the remainder of the district had an almost uniform swing to O’Connor is remarkable considering that the two parts of the district (Columbus and its suburbs, and the remainder) swung in totally opposite directions between the 2012 and 2016 presidential elections. That’s why, when you compare the 2018 special election to the 2012 presidential election, you get a map that looks like this:
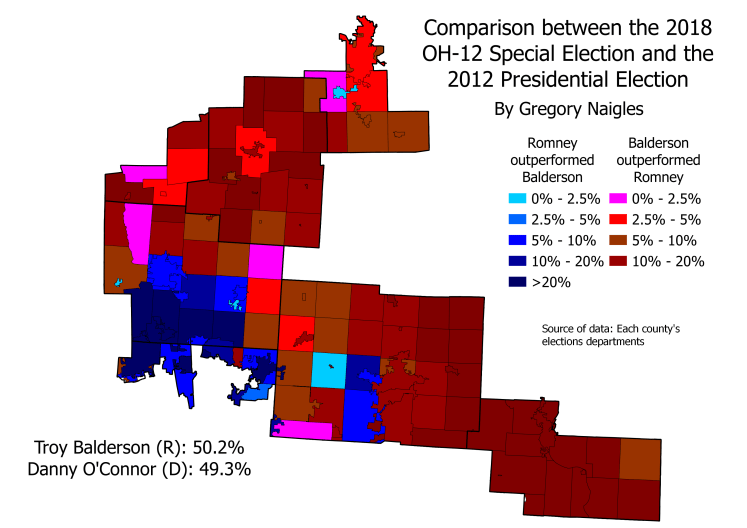
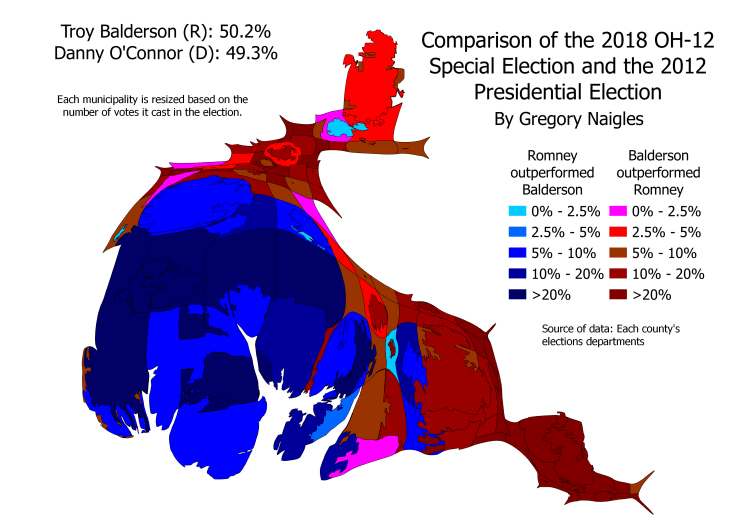
Obama did much better than O’Connor in the rural areas. However, mirroring the shift nationwide, O’Connor massively improved on Obama’s performance in the Columbus suburbs in Franklin and Delaware counties. Some of the best examples of this are the wealthy Franklin County suburbs of Dublin and New Albany. Dublin moved from a 59-40 Romney win to a 49-47 Clinton win, to a 56-44 O’Connor win. New Albany’s shift was even more dramatic – it went from a 66-33 Romney win to a 49-48 Trump win, all the way to a 56-44 O’Connor win.
Vermont
Vermont held its primaries on August 14. The main contests were both parties’ gubernatorial nominations. Republican Governor Phil Scott faced a primary challenge from the right for his signing gun control and marijuana legalization bills into law, but he dispatched his challenger easily.
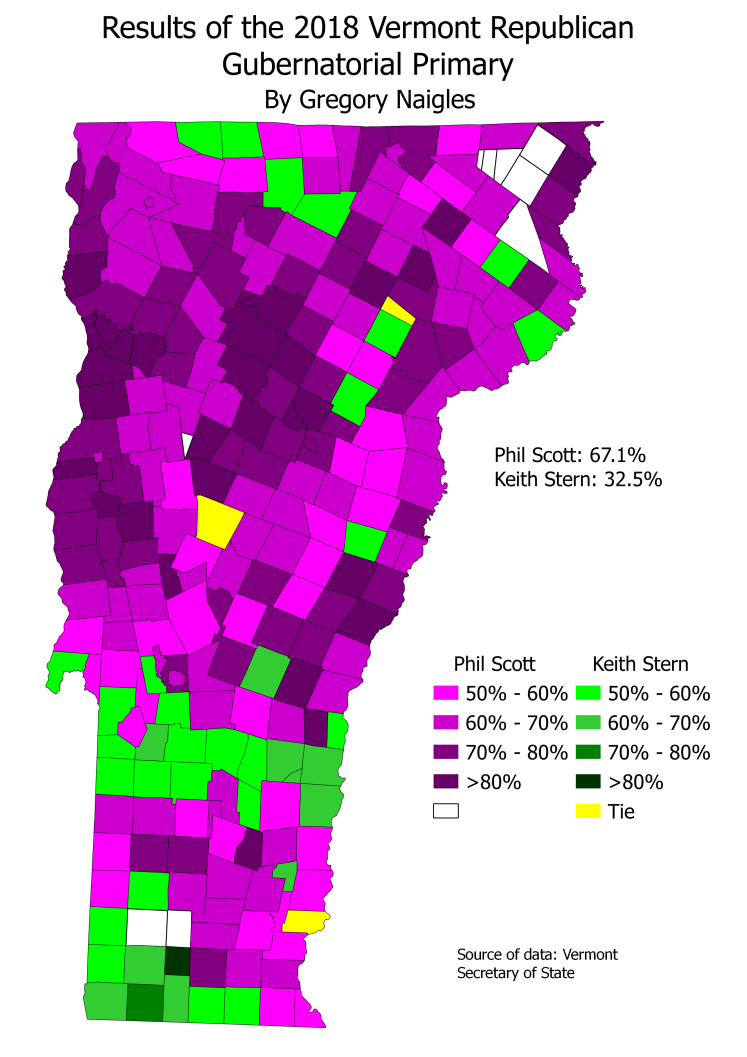
Scott was weakest in parts of southern Vermont, but he crushed it in the Burlington area and in Washington County (which he represented in the state senate before becoming Governor).
The Democrats also held a primary for the right to face Scott in the general election. Christine Hallquist, the first openly transgender gubernatorial nominee in America, won the primary fairly easily.
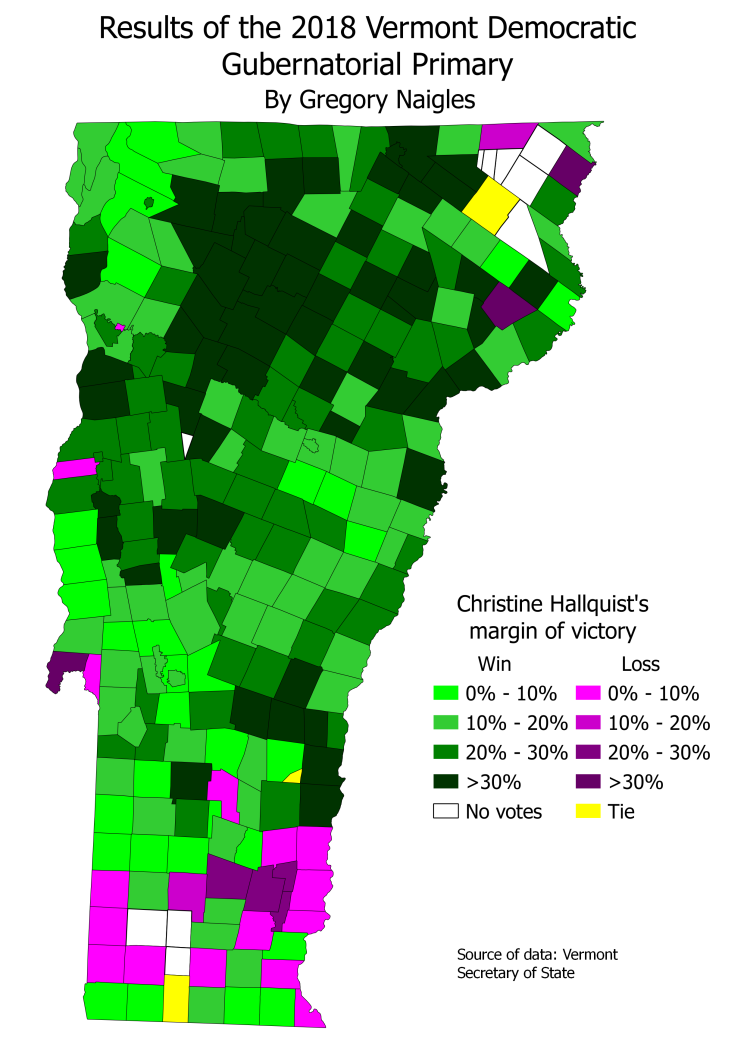
Hallquist was strongest in her home county of Lamoille. She won most other towns in the state by decent margins, only losing a handful in southern Vermont, where both of her major opponents were from.
One of those opponents was particularly notable. 14-year-old Ethan Sonneborn ran in the Democratic primary for Governor. Unlike many other states, Vermont doesn’t require that its Governor be a registered voter or even an adult – they only have to have lived in Vermont for the past five years. While Sonneborn came in last place in the primary, he nonetheless received 4,696 votes, or almost eight percent.
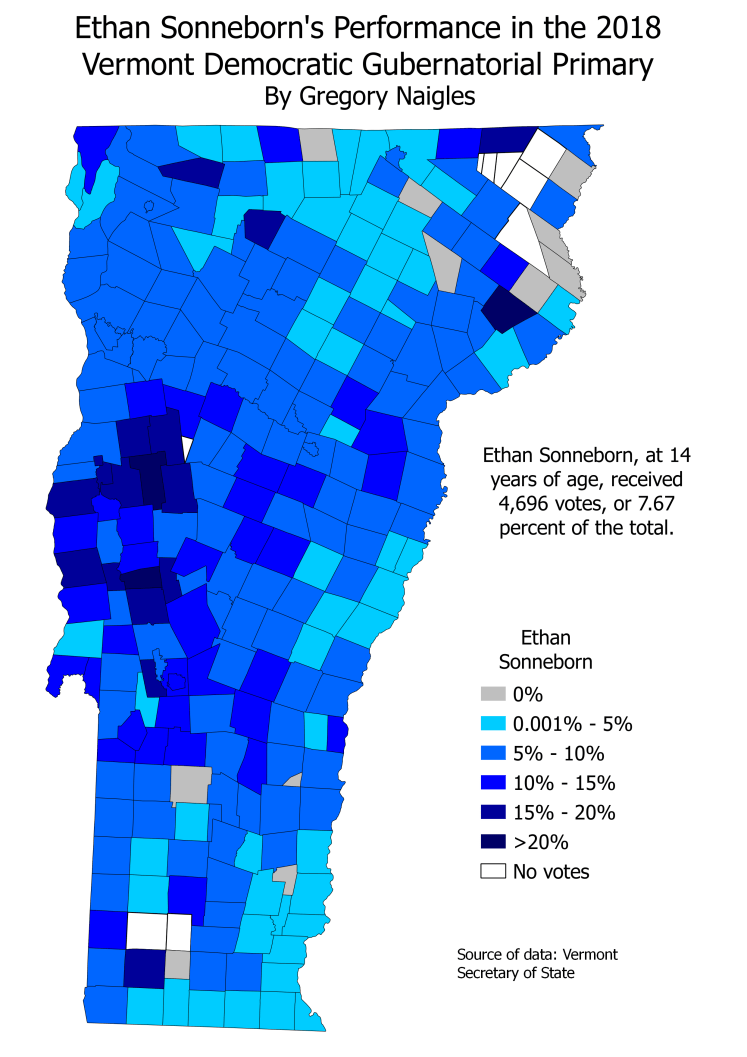
The only major pattern to Sonneborn’s performance is that his best town was his hometown of Bristol, in Addison County, and that he performed noticeably better in Addison County than in the remainder of the state.
Finally, since both parties had contested gubernatorial primaries, we can compare the partisan turnout in each town to make a partisan composition map.
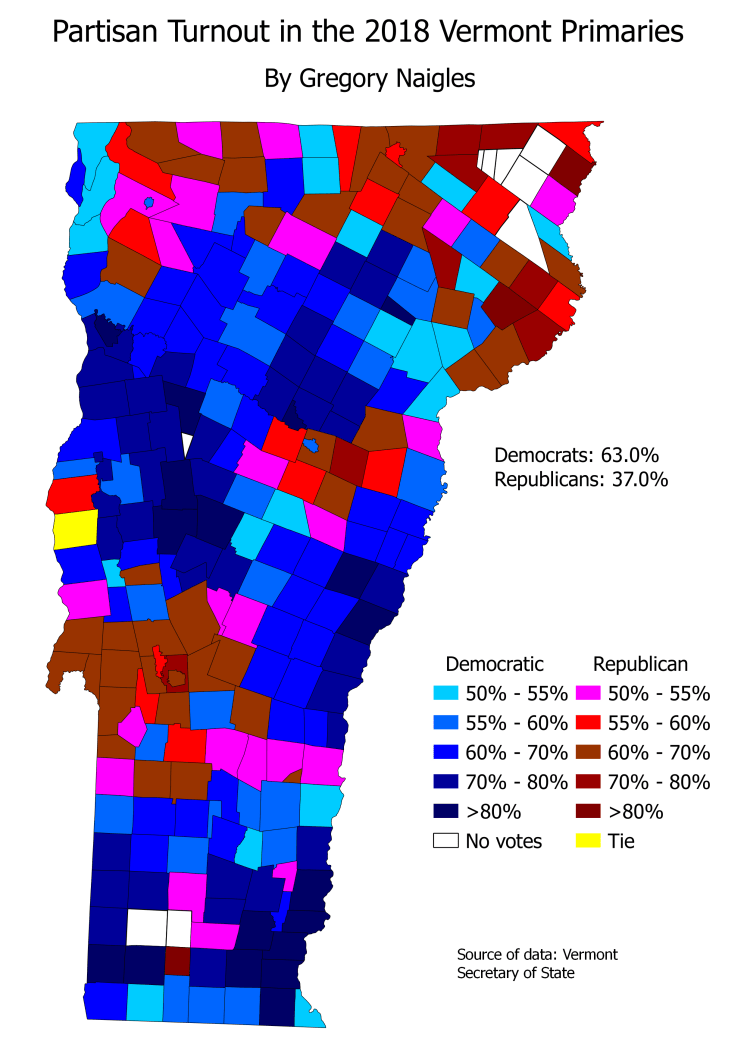
Republicans outvoted Democrats in Rutland County, the Barre area, much of the Northeast Kingdom, and most of Franklin County. Democrats heavily outvoted Republicans in the rest of the state. This is a normal pattern for partisan composition in Vermont, and it lines up very closely with the party that holds each state House district. Overall, Democrats outvoted Republicans by a 63-37 margin, which is a bit narrower than the Dems’ recent presidential victories in Vermont, but still a wide margin nonetheless.
Wisconsin
One of the major races in the Wisconsin primary this year was the U.S. Senate Republican primary, between Leah Vukmir and Kevin Nicholson. A normal county-level map would show that Nicholson won the vast majority of the state’s counties, however Vukmir won the primary by 6 percent.
How did Vukmir win overall while losing most of the state’s counties? She won the larger counties.
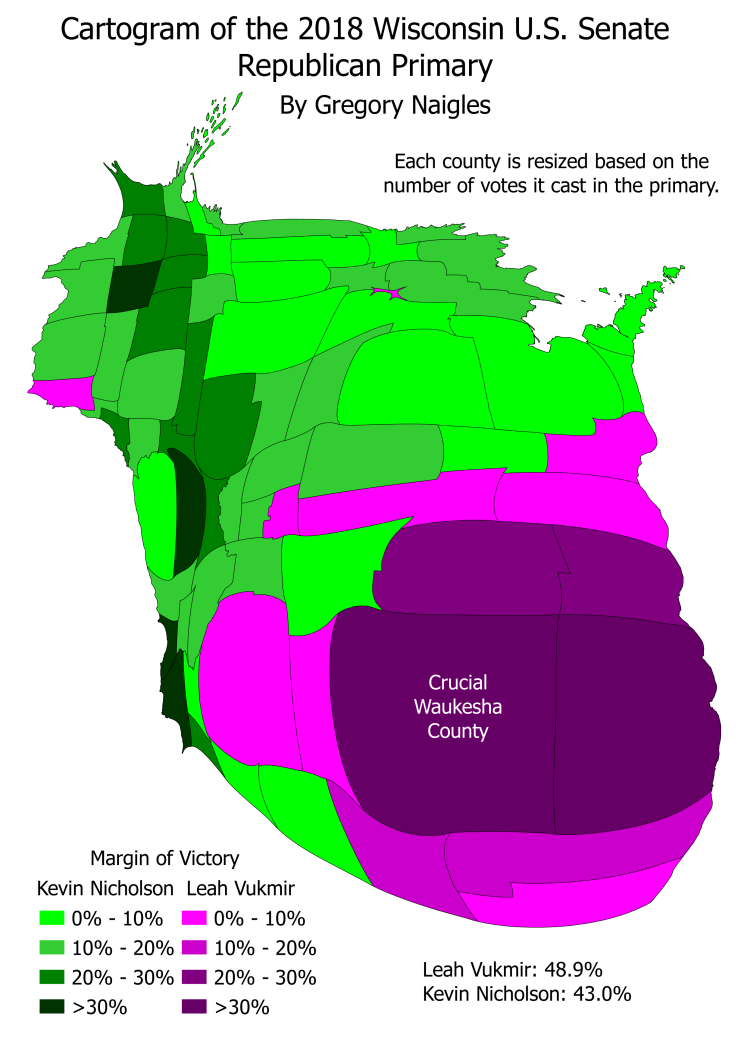
Vukmir won Milwaukee County and its three neighboring, heavily Republican suburban counties in landslides. In fact, Waukesha County alone canceled out 87 percent of Nicholson’s combined margin in every county that he won. There’s a reason why political junkies like to refer to Waukesha County as “crucial” – as a populous, high-turnout, heavily Republican county, it plays a major role in determining both Republican primaries (as shown in this example) and general elections (if Republicans don’t get a large margin out of Waukesha, they’re most likely doomed statewide).
