On April 4, 2023, Wisconsin held an election for a 10-year term on their state Supreme Court. As the continuing members of the Court were evenly divided between liberals and conservatives, this election effectively decided the ideological balance of the Court. The liberal candidate, Milwaukee County judge Janet Protasiewicz, defeated the conservative candidate, former Wisconsin Supreme Court justice Dan Kelly, by a margin of 11 percent, giving liberals a 4-3 majority on the Court. This was the most expensive judicial race in American history, and saw one of the highest voter turnouts of any judicial election in Wisconsin.
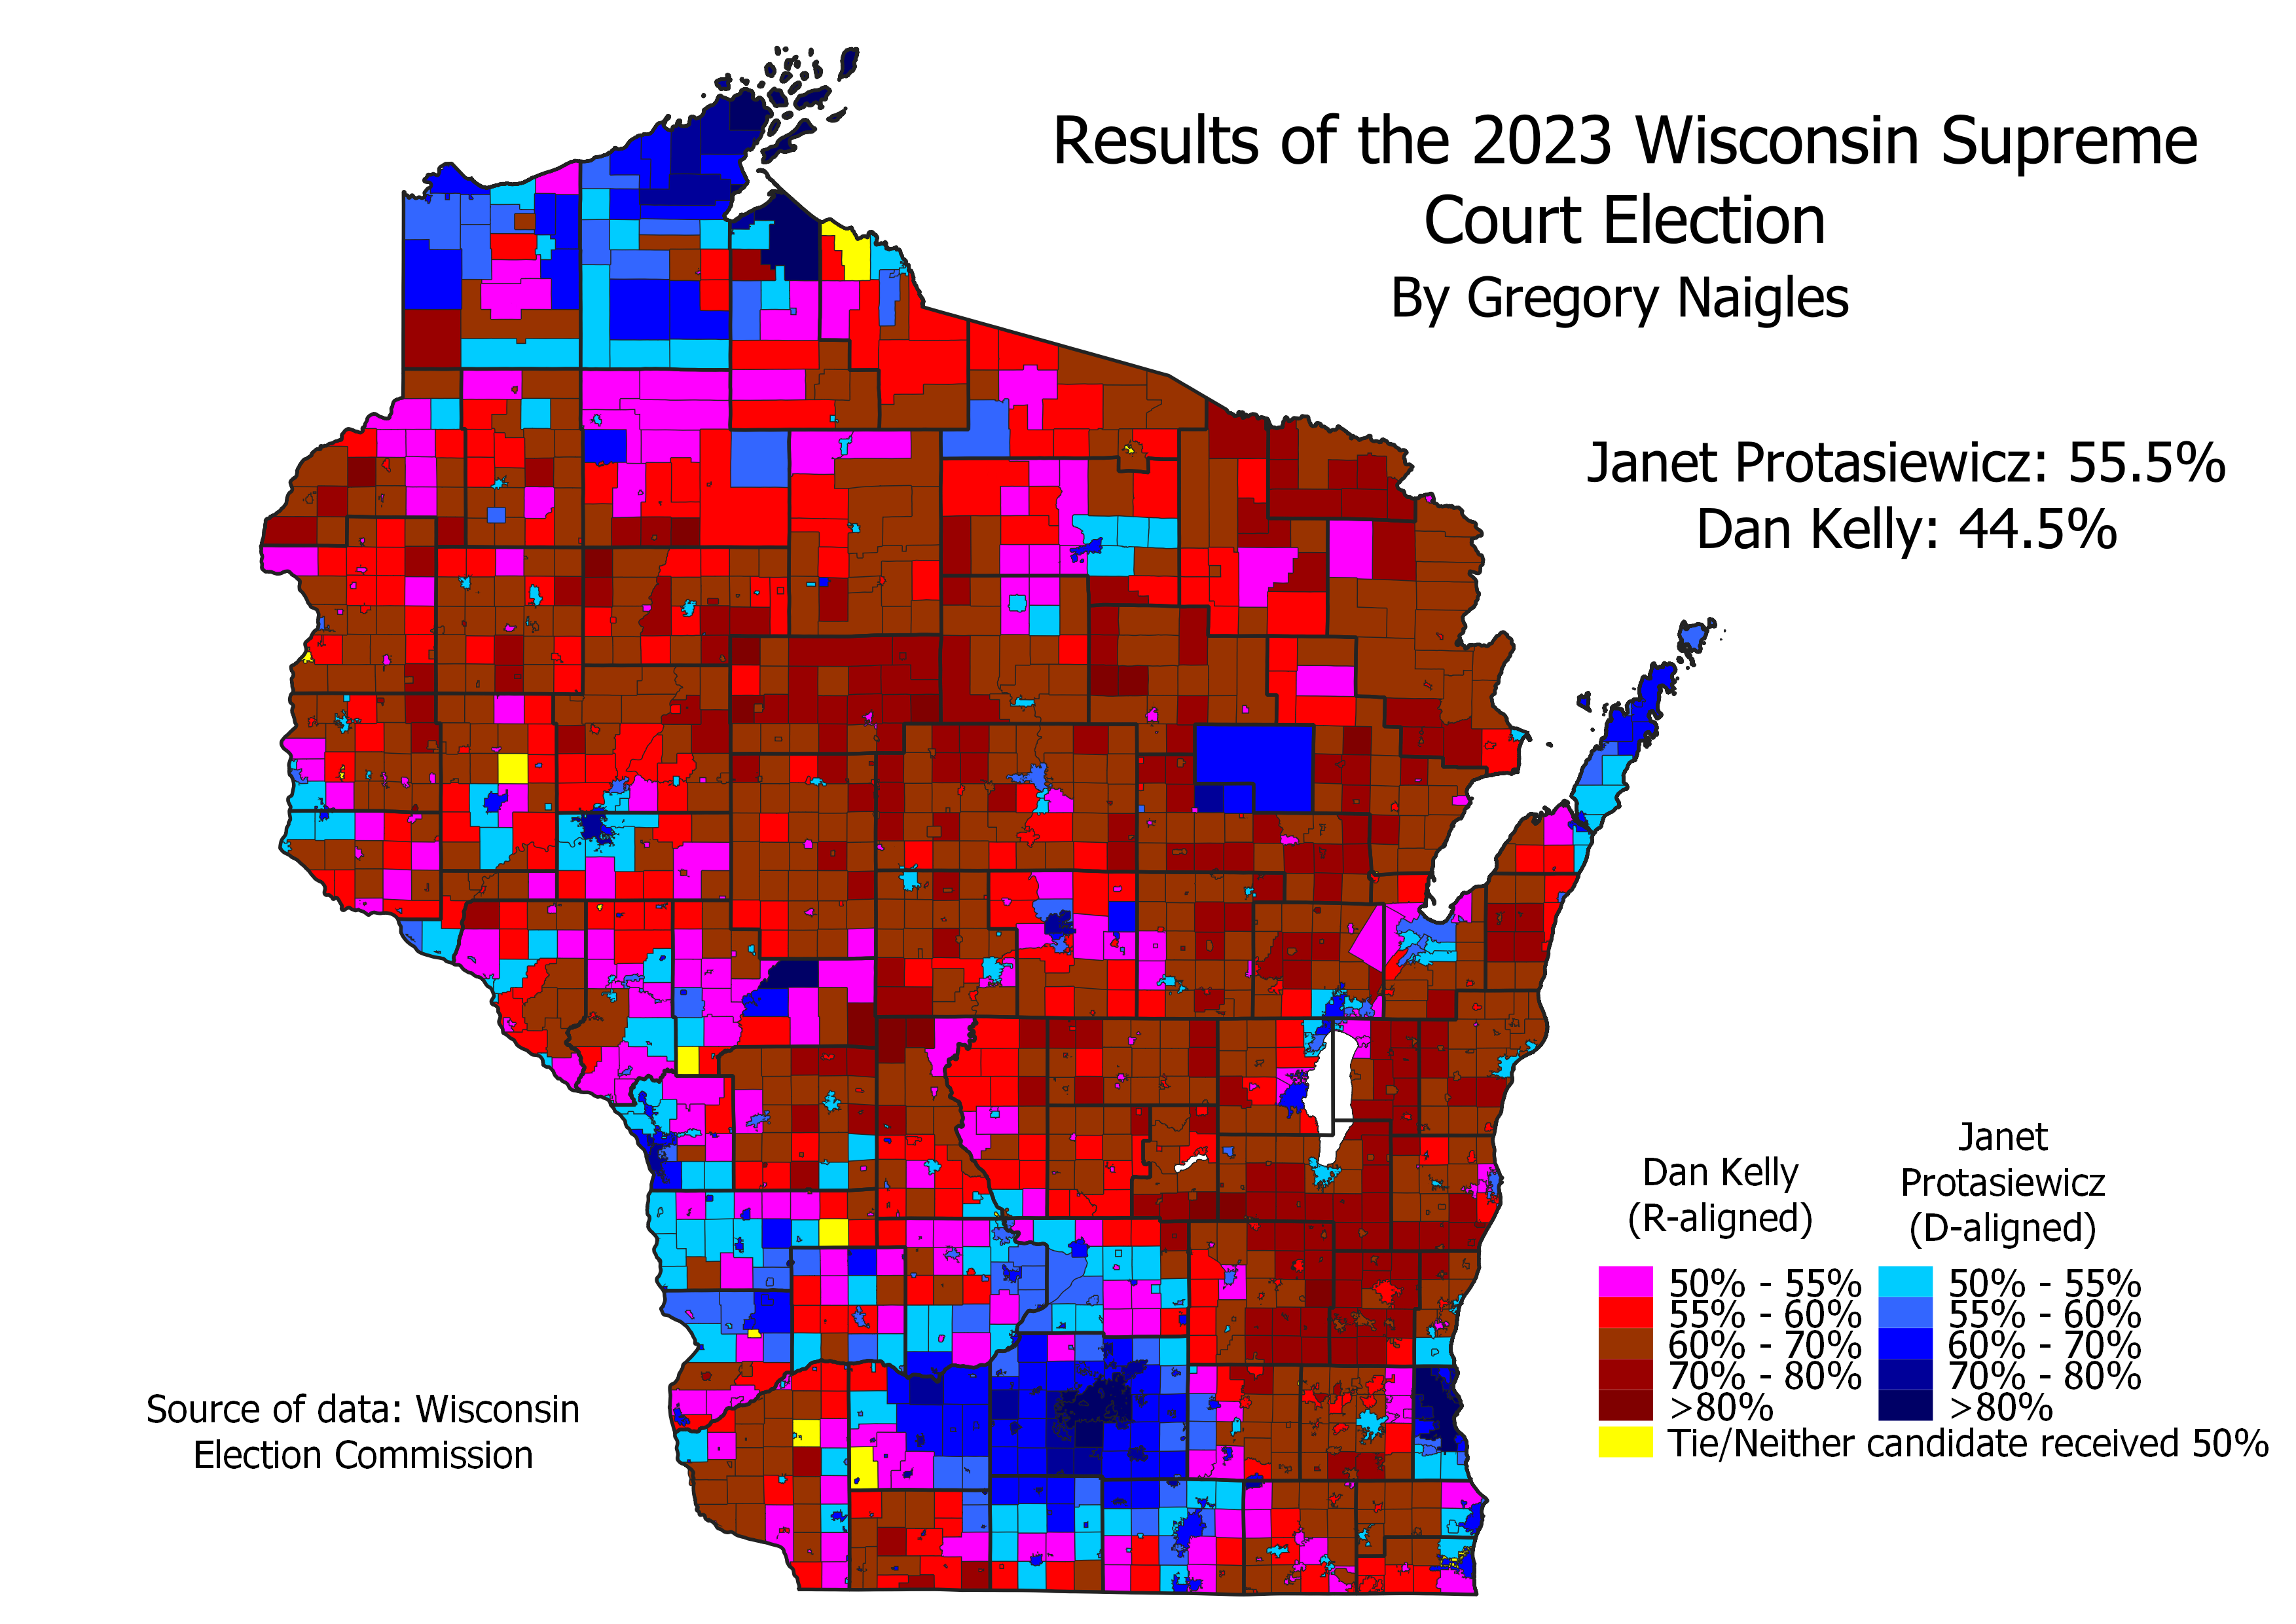
At first glance, this map looks like a fairly standard Democratic victory in Wisconsin – big margins out of Milwaukee and Madison, some residual strength in the rural areas in the western part of the state, Democratic wins in most of the smaller cities of the state, and big Republican margins out of the Milwaukee suburbs and most of the rural areas. However, there’s more to this map than initially meets the eye – it exemplifies the shifts in the Wisconsin electorate that have been ongoing ever since the state was unexpectedly and narrowly won by Donald Trump in 2016.
First, I’ve made a map comparing Protasiewicz’ performance this year to Joe Biden’s in 2020. Protasiewicz won by 11 percent while Biden only won Wisconsin by a very narrow margin of less than one percent, so you’d probably expect Protasiewicz to do better than Biden pretty much everywhere. And sure enough, that’s essentially what happened.

Protasiewicz outperformed Biden in every county in Wisconsin except one, and in the vast majority of municipalities in the state. But there are still a couple of patterns that can be found in the results. First, the margin by which Protasiewicz outperformed Biden tended to be smaller in the Milwaukee metropolitan area, and larger in the rest of the state, particularly in the rural areas. It is difficult to conclusively determine why this might have happened – Republicans could be better organized in Milwaukee while Dems activated their voters in the rural areas, however those same rural areas trended Republican compared to the previous Supreme Court election in 2020 while the areas where Protasiewicz outperformed Biden the least were also the places where she improved the most compared to the liberal Supreme Court candidate in 2020. This pattern is probably mostly a reflection on both the rural areas’ Republican trend and the overall Democratic victory – many rural voters are voting Republican at the top of the ticket while still being willing to vote for Democratic-aligned candidates downballot.
The other interesting pattern in this map is that the counties and towns with large Native American populations almost all trended Republican compared to the 2020 presidential election. The reason for this is much simpler: Native Americans, the vast majority of whom vote Democratic, had substantially lower turnout in this election – more so than the rest of the state – and therefore the Republican-leaning white minorities in those counties and towns constituted a larger share of the vote there than they normally do. There is absolutely no evidence that Native Americans themselves are trending Republican – that idea is contradicted by election results in multiple different states, and the differential turnout rates account for the entirety of the Republican trends in those towns for this election.
Perhaps a more interesting comparison than to Biden’s 2020 performance is to Obama’s performance in 2012. Obama won Wisconsin in 2012 by a margin of 7 percent, just a little bit lower than Protasiewicz’s 11-percent margin this year. But their winning coalitions were very different.
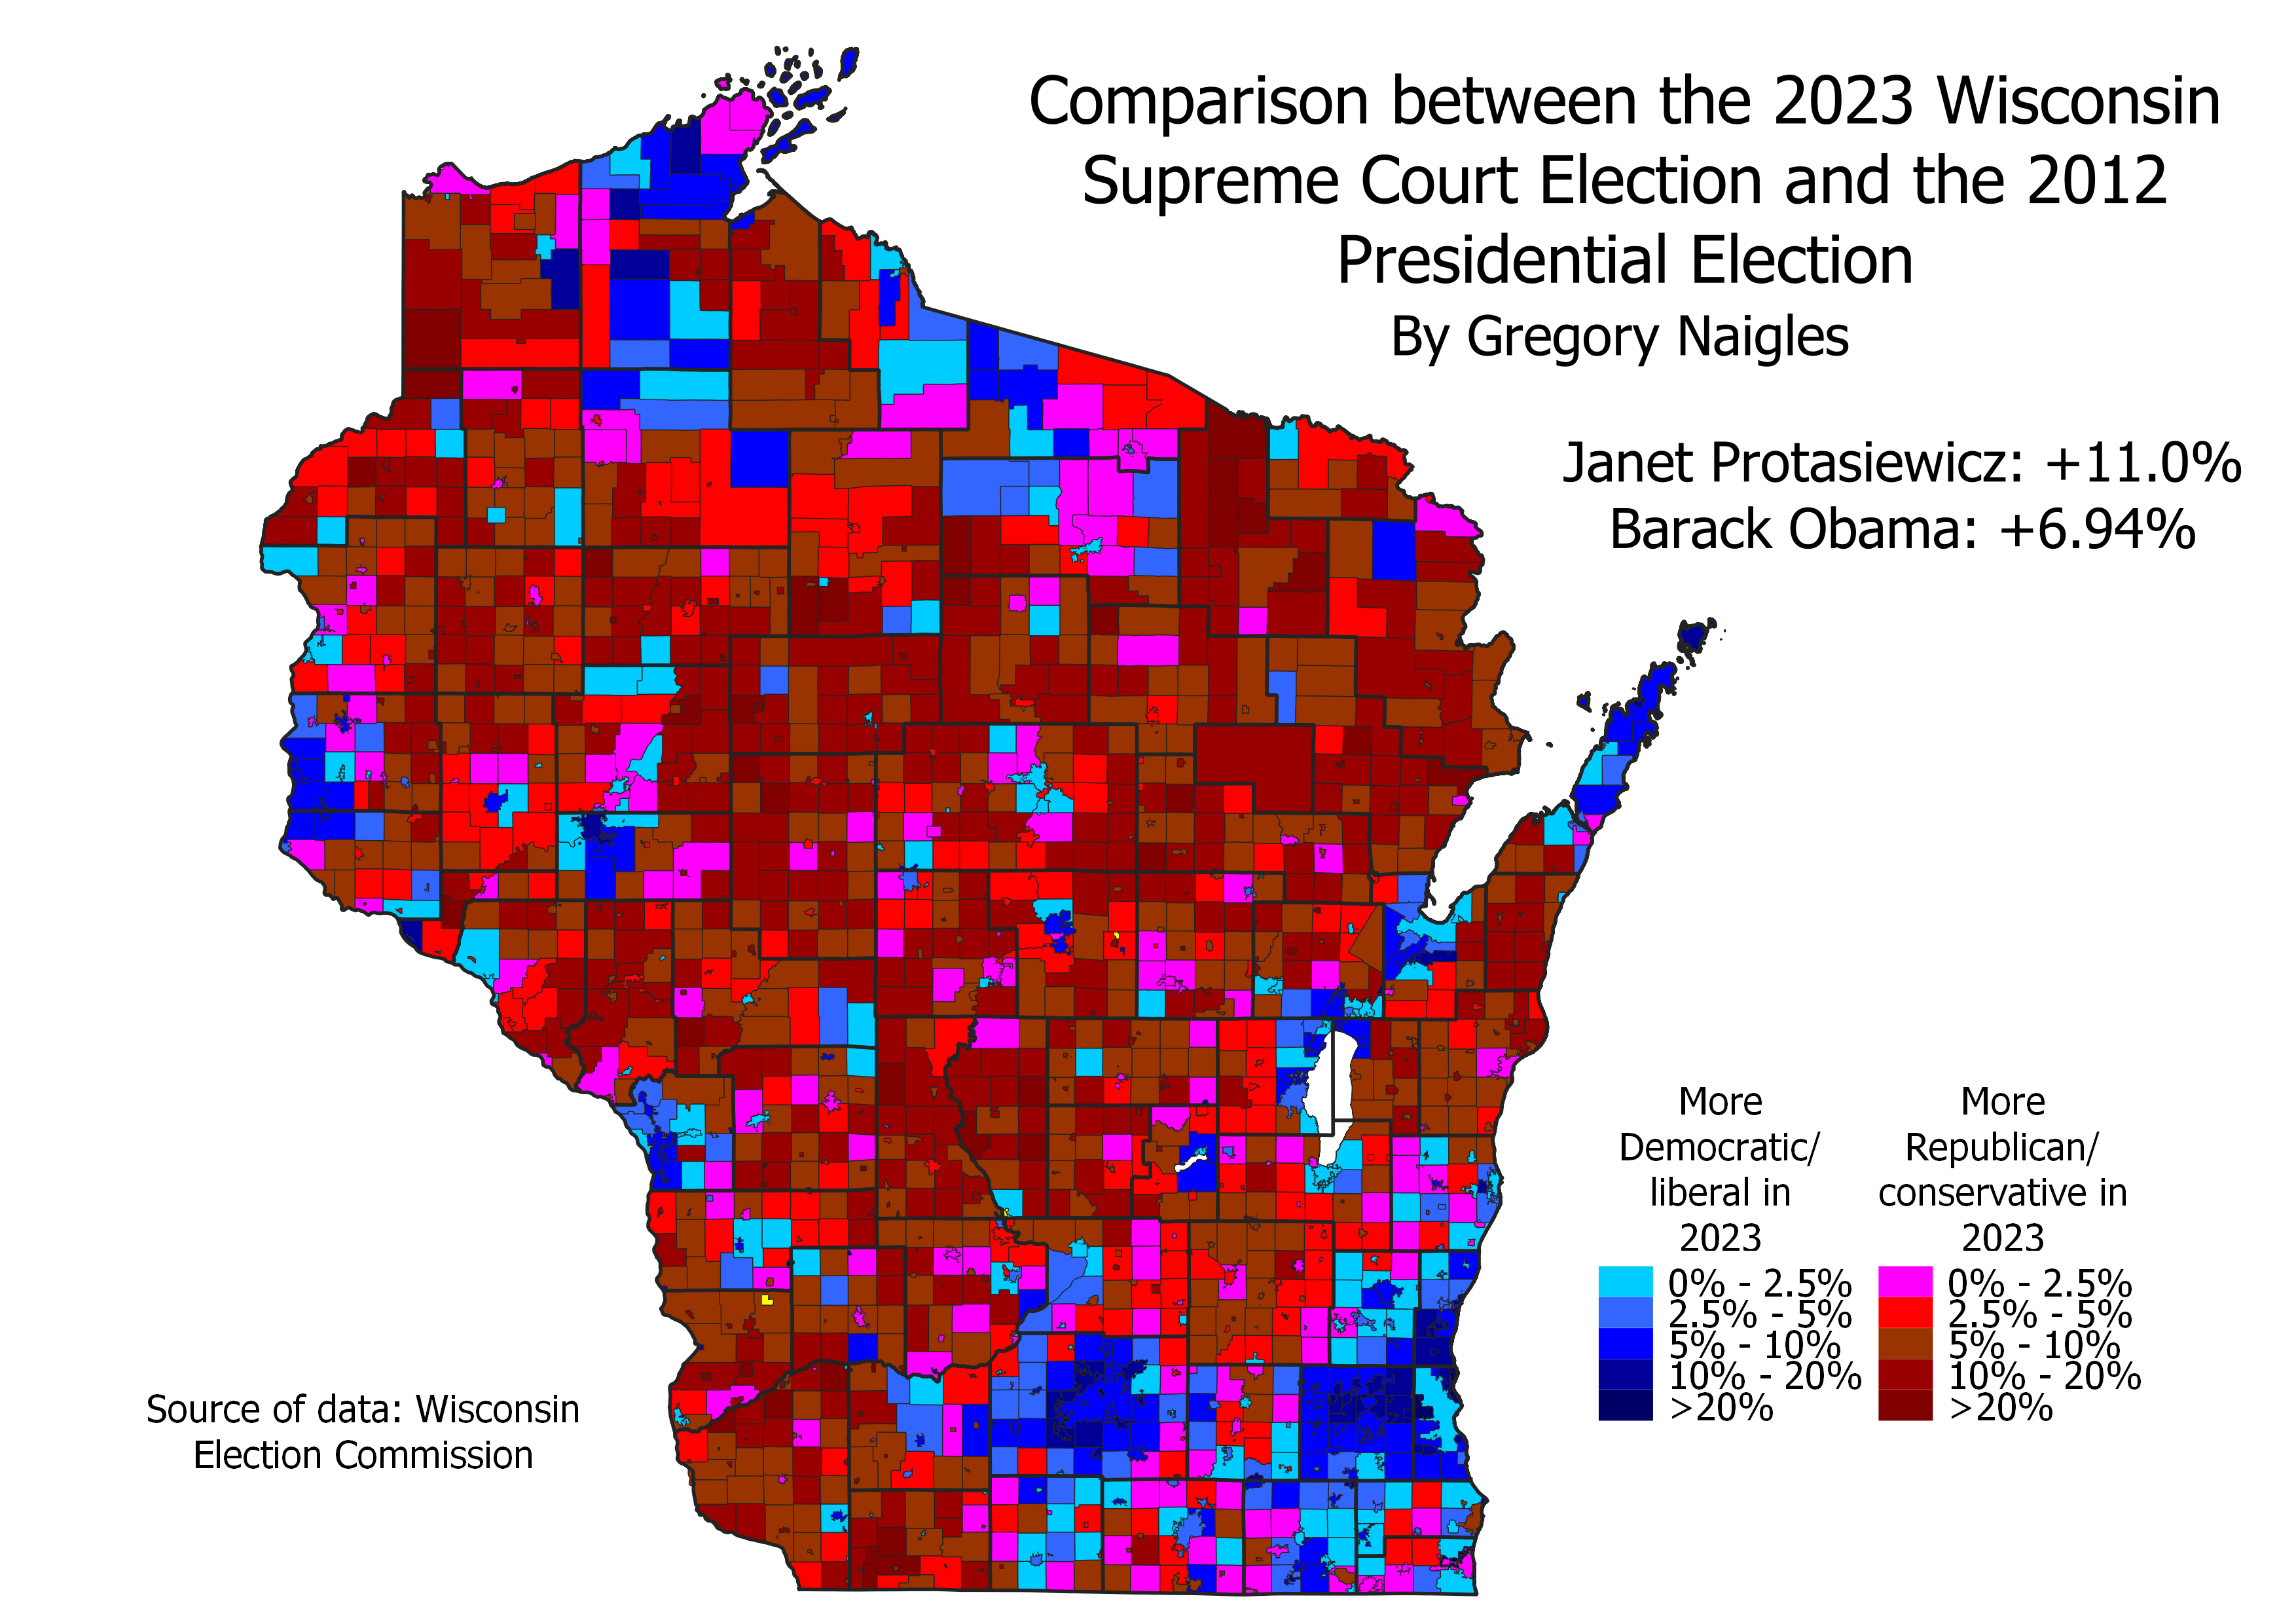
As the above map shows, Protasiewicz underperformed Obama in large rural swaths of the state, sometimes by significant margins. But that was canceled out by Protasiewicz’ extremely strong performance in the Milwaukee suburbs, the Madison area, and most other larger cities and towns across the state. Protasiewicz hit numbers in the Milwaukee suburbs that Democratic-aligned candidates haven’t seen in a long time – winning Mequon, Cedarburg, and the city of Waukesha, losing the formerly deep-red suburb of Brookfield by only 6 percent, and winning the wealthy suburb of Whitefish Bay by almost a 3-1 margin (Obama only won it by a few percent in 2012). But that wasn’t the entire story – Protasiewicz saw similar improvements in Madison and its suburbs, and, crucially, in many smaller cities as well like Appleton, La Crosse, and Eau Claire. Fully 69% of votes this year were cast in municipalities where Protasiewicz outperformed Obama, including most of the state’s larger cities and towns. Stronger support from those areas is how Protasiewicz managed to outperform Obama despite losing support in most of the state’s rural areas. This pattern is superficially similar to those that we’ve seen in most states since Trump became President – rural areas moving to the right while suburbs move to the left – but it is the Democratic shift in the smaller cities that sets Protasiewicz apart, since those same cities saw very little shift to the left in 2020 compared to elections like 2012 that took place before Trump.
I hope these maps helped give you a better understanding of the 2023 Wisconsin Supreme Court election results, and the vote shifts and patterns behind them. As always, please leave a comment and let me know what you think!
