[Updated February 2019]
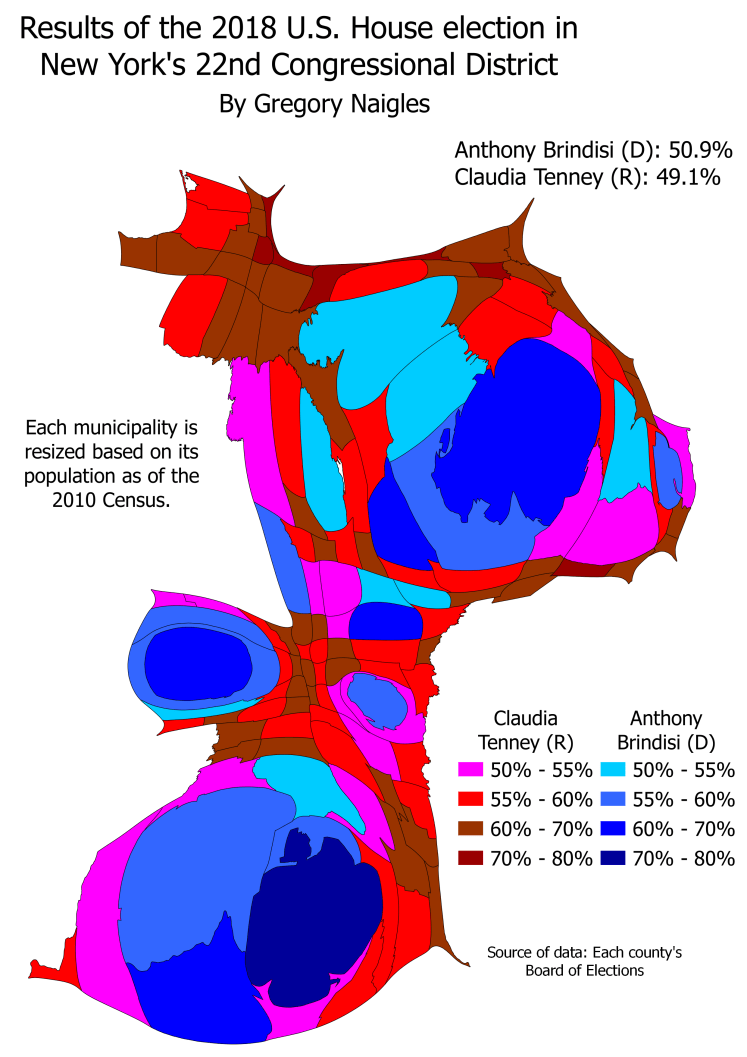
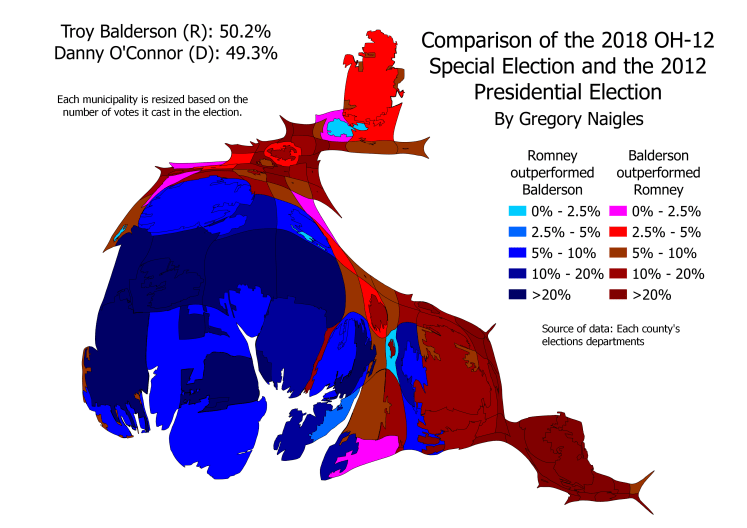
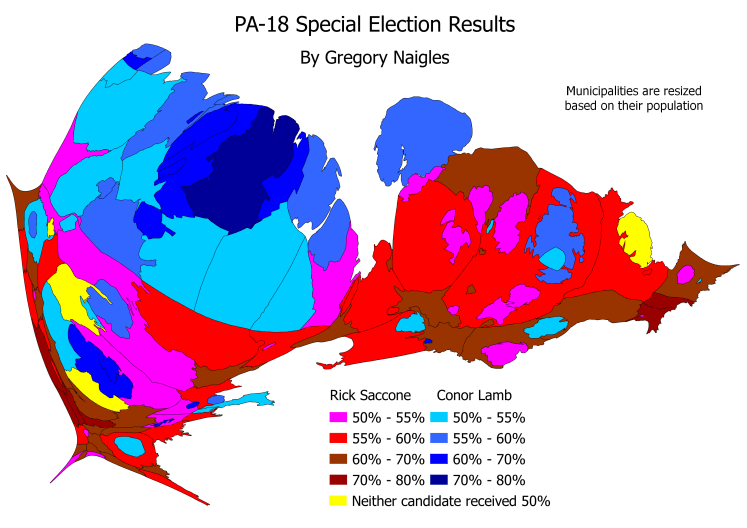
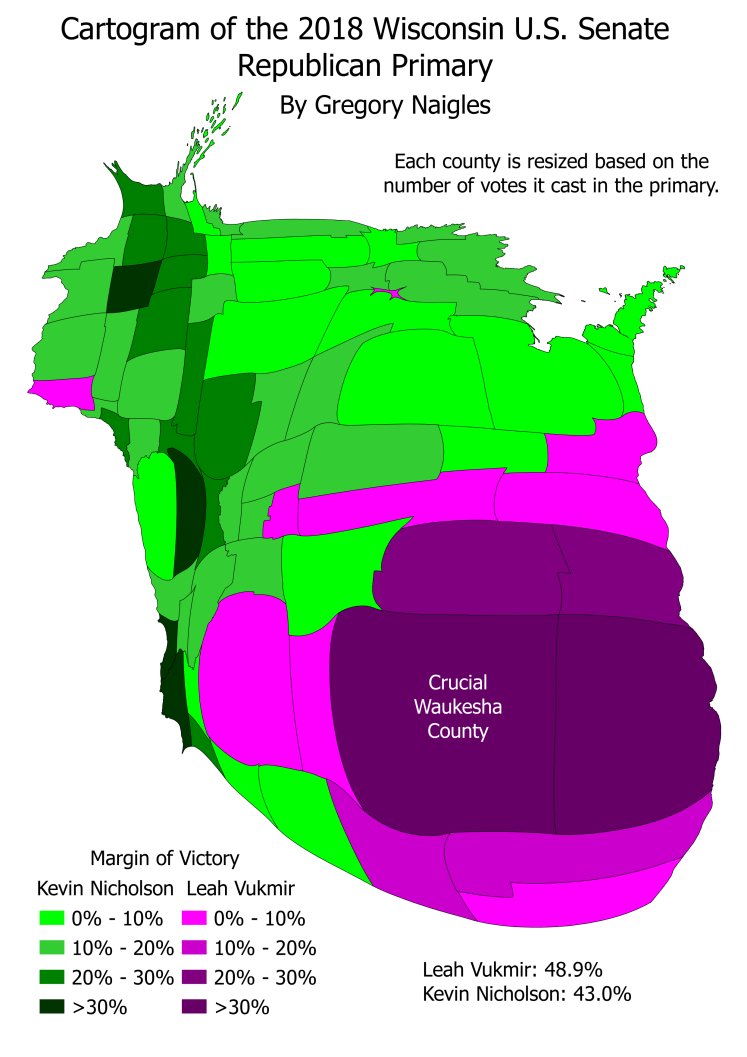
A cartogram is a map where some mapping variable is substituted for land area or distance. Cartograms are frequently used to depict cities or towns based on their population rather than their land area. This allows maps to accurately show the impact that large concentrations of people have on election results.
I have made numerous population-based cartograms of election results. States that I have turned into cartograms include Connecticut, Maine, Massachusetts, Michigan, New York, Ohio, Pennsylvania, and Wisconsin. A few examples are below.