Despite the Republican wave, both Governor Maggie Hassan and U.S. Senator Jeanne Shaheen won narrow re-elections in 2014 in New Hampshire. Both of their 2014 wins were slightly narrower than their previous elections; Shaheen won by 3 percentage points in 2014 while she had won by 7 in 2008, and Hassan won by 5 percentage points in 2014 while she had won by 10 in 2012. However, Shaheen’s 2014 percentage was very close to her 2008 percentage, due to the fact that a Libertarian ran in 2008 and received 3 percent, while no third-party candidates ran in either election in 2014.
The political geography of Hassan’s and Shaheen’s wins were quite similar, and both generally demonstrated the usual patterns of election results in New Hampshire, but there were several interesting patterns nonetheless in the election results. In this article, I present maps of the 2014 gubernatorial and senatorial elections, and then compare them to the winners’ previous elections and analyze how the results changed between the elections. I will start with the 2014 gubernatorial election.

Governor Hassan’s 5-point re-election in 2014 used the pretty standard coalition for Democratic victories in New Hampshire: big wins in Cheshire County, Concord, the Lebanon-Hanover area, and the Portsmouth-Durham area, while minimizing losses in the rest of southeastern New Hampshire as well as in the Lake Winnipesaukee area. This is a very similar coalition to the one she used in her initial election in 2012, with one important difference. This next map shows that difference quite clearly.
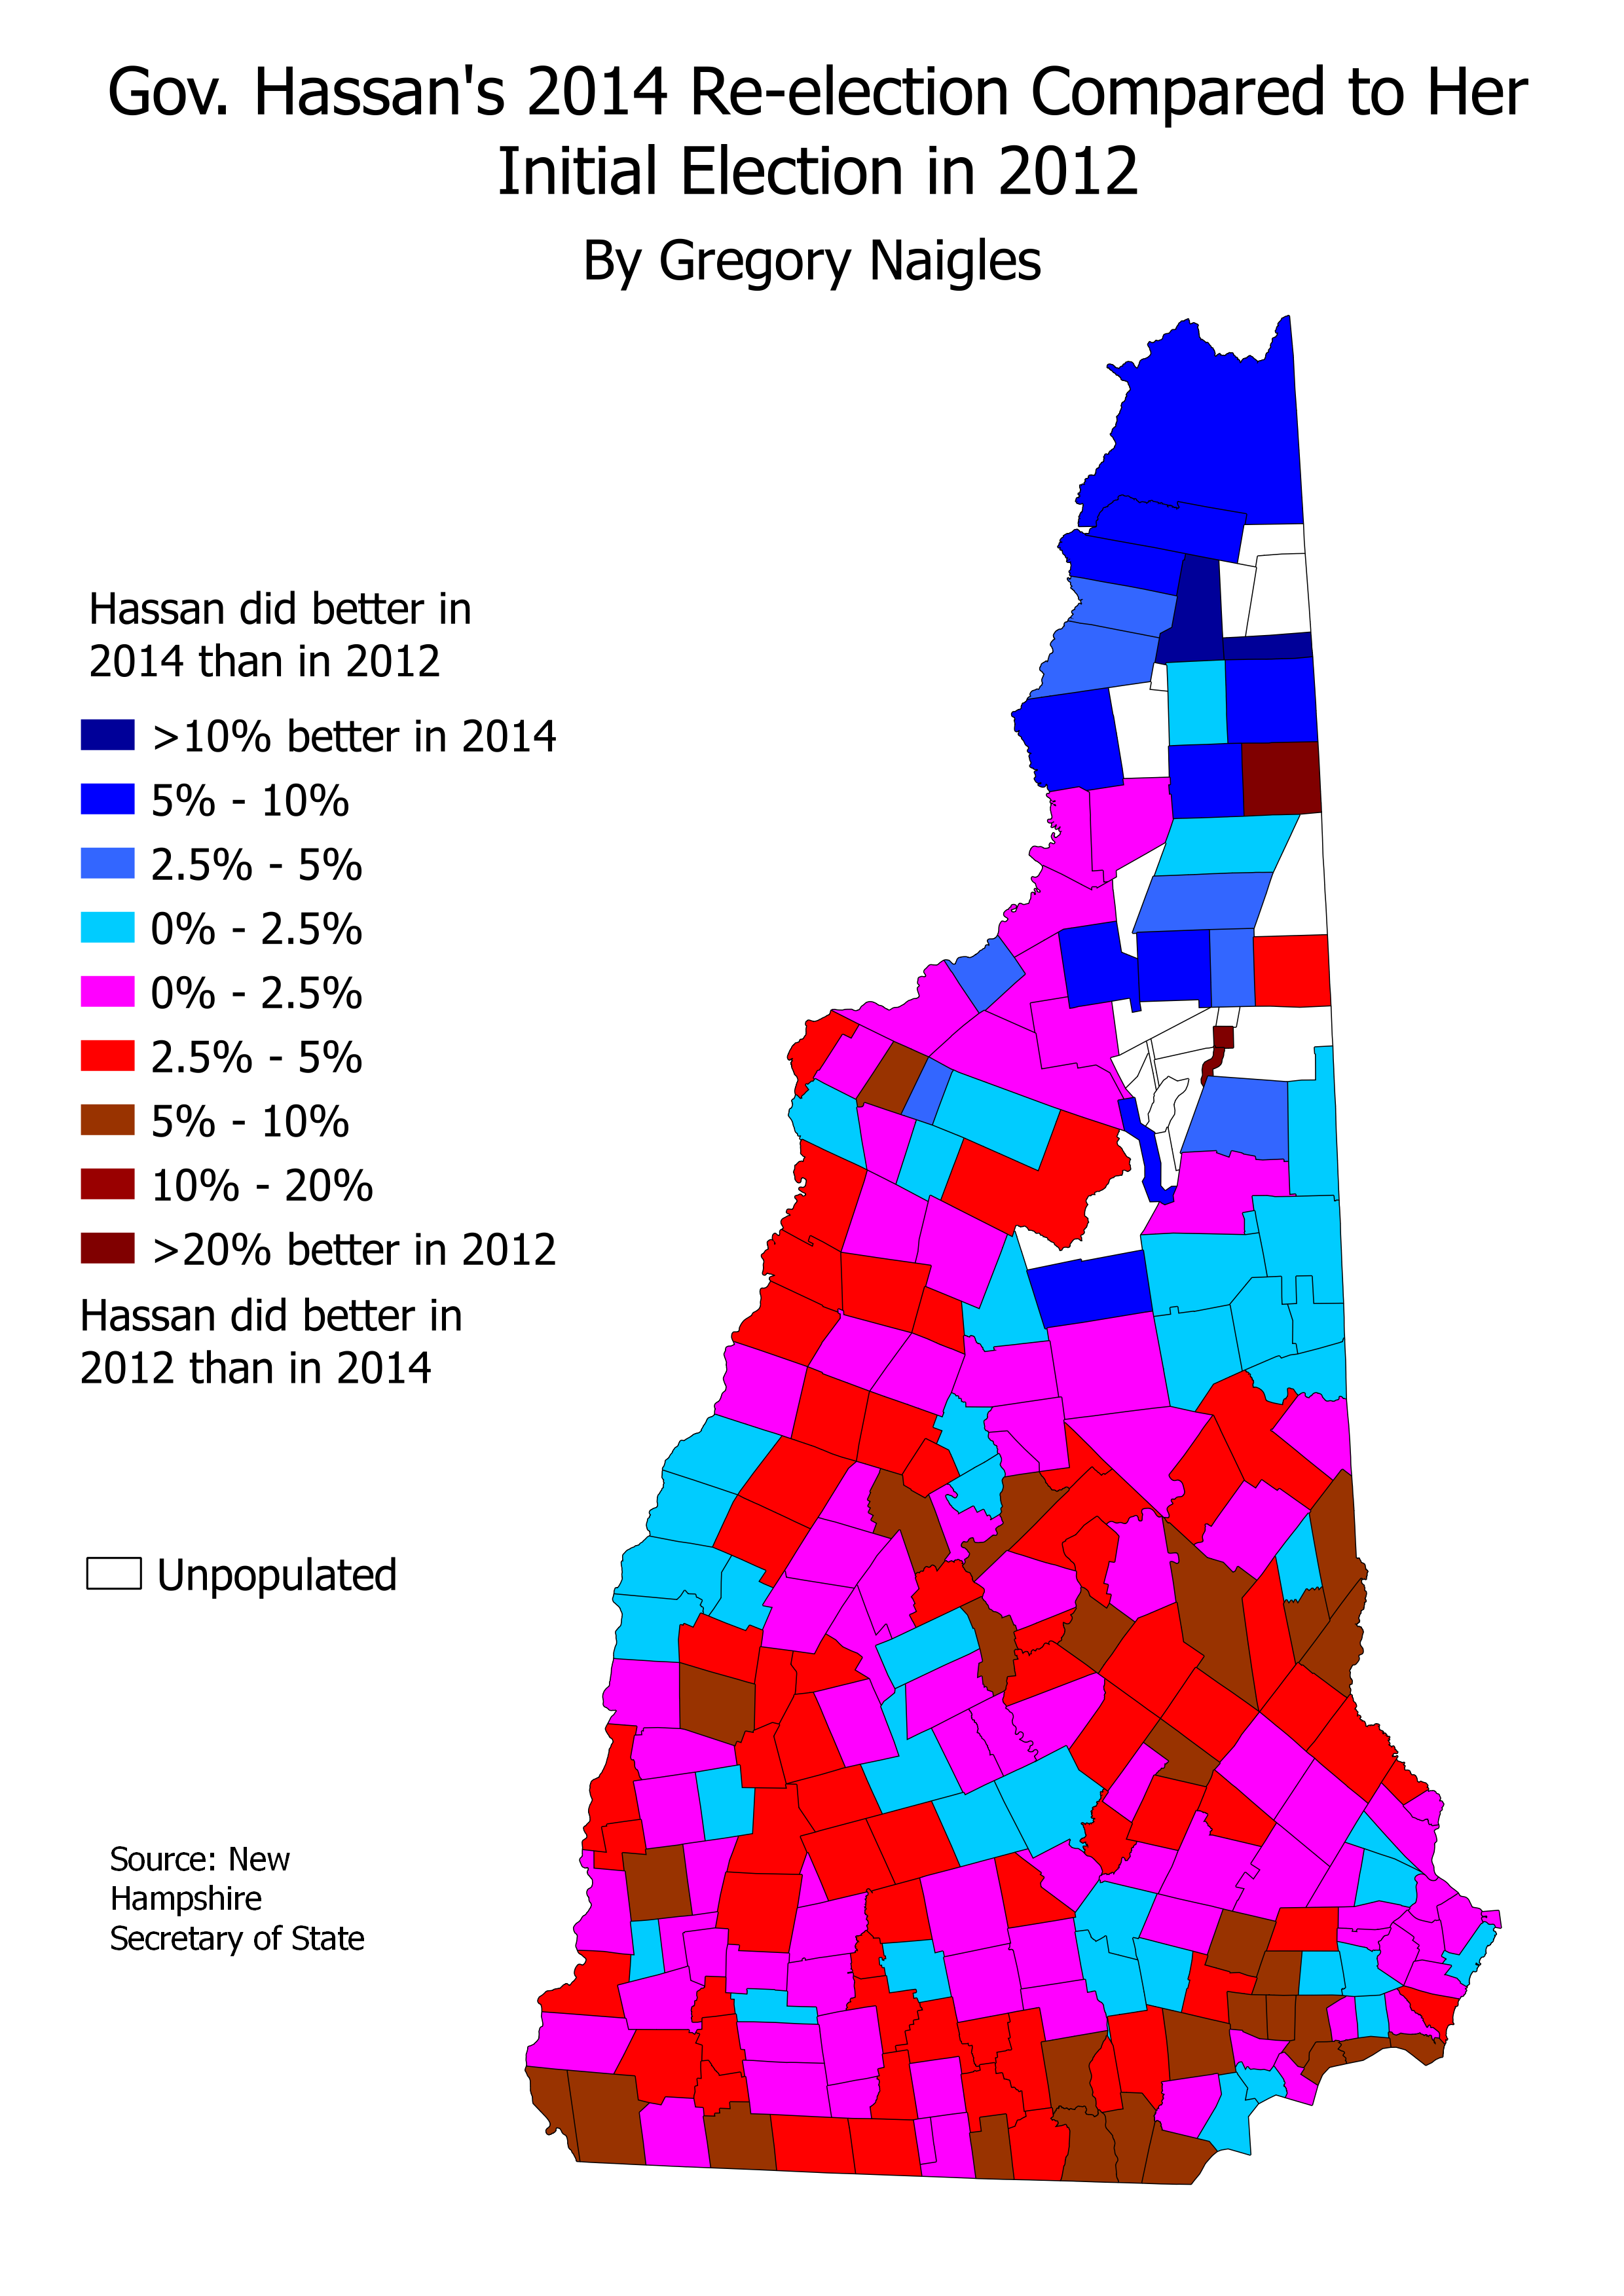
This map compares Hassan’s 2014 re-election to her initial election in 2012. Hassan’s overall percentage dropped about 2 percentage points from 2012 to 2014, and in most of the state, that drop in performance was relatively evenly distributed. However, there are a few notable patterns in this map.
First, most the heavily-Democratic towns in New Hampshire saw Hassan’s performance stay relatively constant between 2012 and 2014. This is true of New Hampshire’s university towns, including Hanover, Plymouth, Keene, and Durham, as well as other heavily Democratic towns such as Lebanon, Concord, and Portsmouth. Another pattern is that the Nashua area swung heavily Republican from 2012 to 2014, as evidenced by Republican pick-ups in 2014 in the Executive Council and the State Senate in this area. While this area constitutes only around ten towns, this is a heavily populated area of New Hampshire, and in a close race, a drop in performance like this could make a big difference.
However, the most obvious and most important change in Hassan’s performance from 2012 to 2014 lies in the North Country, Coös County. Hassan substantially improved on her 2012 performance in 2014 in almost every town in Coös County, and mostly by significant margins. In fact, Coös County gave Hassan over 60 percent of the vote. Previously, this kind of Democratic landslide on Coös County only happened when Democrats were winning statewide in landslides (such as in the 2006 and 2008 gubernatorial elections). But now, Coös is giving Democratic candidates landslide margins even when the overall election is close.
Now, over to the Senate election.

Senator Shaheen won re-election in 2014 over former Massachusetts Senator Scott Brown by only three percentage points. However, most of the map of her election results looks pretty similar to Gov. Hassan’s map, where she won by 5 points, or even Obama’s 2008 and 2012 maps, where he won by 9 and 6 points, respectively. But there’s one major difference between Shaheen’s 2014 map and most other New Hampshire election maps of narrow Democratic wins. This difference will soon be quite clear.

This map compares Shaheen’s 2014 re-election with her initial election in 2008, where she defeated incumbent Republican John E. Sununu. The map shows that, despite the fact that Shaheen’s 2008 and 2014 percentages were only a few tenths of a percentage point different, she actually improved from 2008 in most towns in New Hampshire. She posted substantial improvements in most of Grafton County, the Concord area, and northern Carroll County, and she improved dramatically in Coös County. In fact, Coös was Shaheen’s best county, a distinction that has almost always gone to either Cheshire or Grafton. It is likely that one reason why Coös County voted so heavily for Shaheen was that they didn’t like the idea of Scott Brown, a former Senator from Massachusetts, carpetbagging into New Hampshire, and considering that Coös County is the New Hampshire county furthest from Massachusetts, any backlash to Brown’s carpetbagging would have the greatest impact in Coös. In addition, it wasn’t just in the Senate election that Coös voted heavily Democratic; Hassan also did very well there, state senator Jeff Woodburn (D) easily won re-election there, and Democratic Executive Council candidate Mike Cryans posted a solid win in Coös even while losing the district by a narrow 1.5 percent. It will be interesting to see whether Coös will continue to trend Democratic, or whether Democrats’ strong performances there in 2014 will be more of a one-time event.
Shaheen ran roughly even with her 2008 performance in 2014 in Hillsborough County. The major areas where she lost ground in 2014 were in the southern part of Rockingham County, close to the border with Massachusetts. These are the areas of New Hampshire that are full of transplants from Massachusetts, and these people are more likely to know of, and have positive opinions of, Scott Brown from his time as U.S. Senator from Massachusetts (after all, Brown had a positive favorability rating in Massachusetts even as he lost to Elizabeth Warren in 2012). This knowledge and previous opinions of Scott Brown clearly influenced the votes of many people in southeastern New Hampshire.
But hold on a minute. How do we know that Shaheen’s decline in performance in southeastern New Hampshire in 2014 wasn’t due to other factors, maybe her overperforming there in 2008? Well, to demonstrate that, I’ve got one more map. This one compares Shaheen’s and Hassan’s performances in their 2014 elections. Towns where Shaheen did better are colored in blue, and towns where Hassan did better are colored in red.

As you can see, there’s a lot of overlap between the towns where Shaheen did worse in 2014 than in 2008, and the towns where Hassan substantially outperformed Shaheen in 2014. This strongly suggests that Shaheen who did worse than normal in this area in 2014 rather than overperforming in 2008, since Shaheen’s 2008 numbers here are similar to Hassan’s in 2014, as well as Obama’s in 2012. Thus, Scott Brown clearly convinced a good number of normally left-leaning voters in southeastern New Hampshire to vote for him in 2014.
However, Brown had very little special strength outside of that area. As the map shows, Shaheen and Hassan ran very close to each other in pretty much the entire rest of the state. The only areas where Shaheen outperformed Hassan more than slightly were rural areas of Grafton and Coös Counties.
I hope this article gave you a bit more insight into the 2014 election results in New Hampshire!

Thanks great blogg
LikeLike