On March 13, 2018, Democrat Conor Lamb won the special election in Pennsylvania’s 18th Congressional district by a slim margin of just over 600 votes. This was a significant upset, considering that the previous incumbent, Republican Tim Murphy, hadn’t been seriously challenged for over a decade, and that the district voted for Donald Trump by 20 percentage points.
So how did Lamb do it? Was his win a demonstration of Trump-era political changes that could be replicated across the country? Or was his win merely a reflection of the candidates and their campaigns, and doesn’t mean anything for other races? Below, I will present maps of the election results, and use demographic and politico-geographical analysis to attempt to answer those questions. In order to show where the population in the district is concentrated, I have also made cartograms of the each of the maps, where each municipality is resized based on its population, to allow for a better understanding of the district’s political geography.
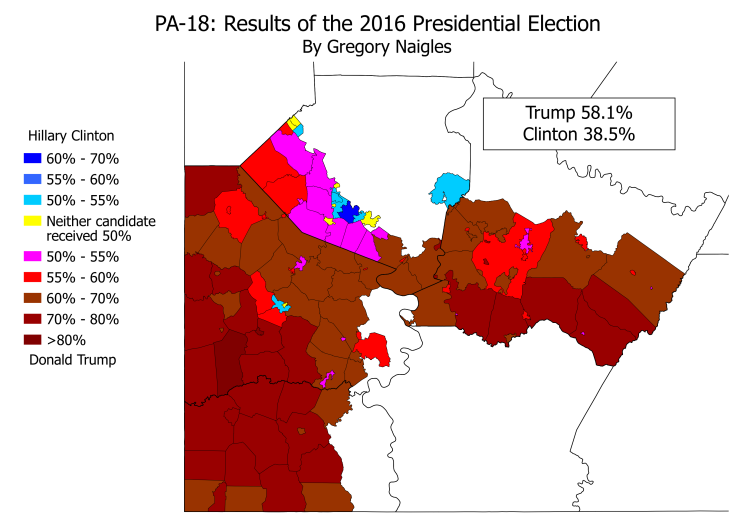
PA-18 is normally solidly Republican. Every statewide Republican carried it in 2016, Trump receiving the largest margin of them all. This is how the district voted in 2016:
And this is how it voted in the 2018 special election:


While there’s clearly still a significant amount of red on the maps above, it’s easy to tell that there’s also a lot more blue, particularly in Allegheny County. And as the cartogram demonstrates, those blue towns in Allegheny County are substantially more densely populated than most of the rest of the district, and thus have much more of an impact on the election results than it may seem from the normal map.
How did the 2018 special election results compare with the 2016 presidential election? Was Conor Lamb’s victory due to one particular part of the district swinging massively toward him, or did the entire district swing toward him?
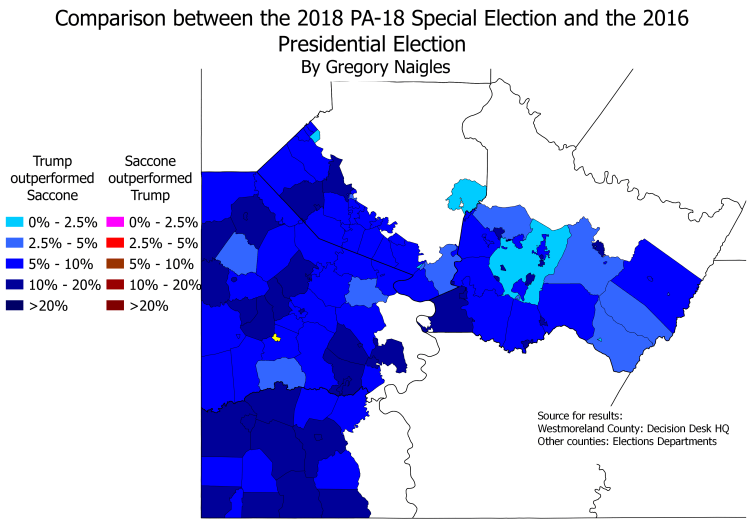

Turns out that the swing from 2016 to the 2018 special election was pretty close to uniform across the entire district. Rick Saccone, the Republican candidate, underperformed Trump in every single municipality in the district. This sort of near-uniform swing is actually fairly uncommon, and there are two major reasons why it occurred here:
- Lamb received a large swing in the well-educated suburbs of Pittsburgh because those areas nationwide have been at the forefront of anti-Trump activism
- Lamb received a large swing in the small towns and rural areas in the district because those areas are historically Democratic, and many of the people who live there have probably voted Democratic at least once or twice in the past decade
If those rural areas had not been historically Democratic, Lamb would most likely not have done as well in them as he did, and he wouldn’t have won the election. It also helped that Lamb ran a campaign that was geared toward those historically-Democratic, working-class rural areas – a campaign mostly focused on economic issues, rather than the social issues such as immigration that have pushed many of those voters toward the Republicans. Other Democrats in the past year (such as most of the ones in Virginia) ran campaigns that emphasized both economic and social issues, and they did very well in the well-educated suburbs but did not improve upon Hillary Clinton’s performance in rural areas. In Virginia, that was enough for most of them to win. In PA-18, it certainly would not have been, which is why Lamb was smart to run the kind of campaign that he did.
Now it’s time to take a look at turnout. In other elections, both regular and special, since Trump was elected, Democrats have frequently turned out at considerably higher rates than Republicans. Was that true this time?

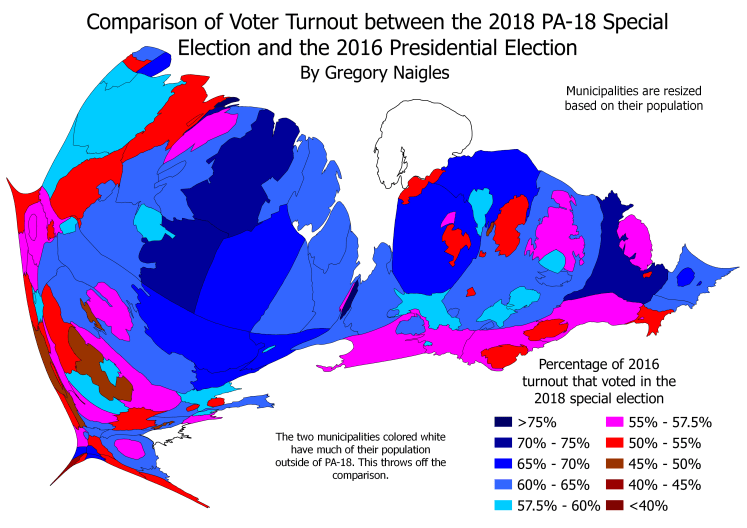
The answer to that question is… yes and no. Yes, Democratic turnout was quite high in Democratic towns such as Mount Lebanon (the most Democratic town in the district, and Lamb’s hometown) and in other nearby Democratic-leaning towns. And yes, turnout was substantially lower in most of the district’s rural areas. However, turnout was also fairly high in the Republican suburban towns in Westmoreland County, including North Huntingdon, Penn, Hempfield, and Unity. And while those towns did vote more Democratic than the usual Democratic baseline there, they did not swing Democratic anywhere near as much compared to the normal Democratic baseline as the Allegheny County suburbs did. One reason for this is that the Westmoreland County suburbs do not have as high levels of educational achievement as those in Allegheny County. This is a small, but noticeable, warning sign for Democrats that they shouldn’t assume that all suburbs will swing toward them in the 2018 elections – only the well-educated ones.
There’s one other turnout-related note that I should add, and it concerns race. I haven’t mentioned race yet because PA-18 is overwhelmingly white – according to the 2010 Census, it is 96 percent white and only 2 percent African-American. Thus, neither candidate needed to make any significant outreach to African-American communities. Only two municipalities in the entire district are more than 10 percent African-American – Jeannette, in Westmoreland County, and the city of Washington, in Washington County. As the turnout map shows, however, both Jeannette and Washington saw substantially below-average turnout in the election. While this does not prove that African-American engagement in the PA-18 special election was low, it does suggest that Democrats shouldn’t assume that African-Americans will turn out at rates similar to suburban white voters, and that Democrats should actively engage with the African-American community to get them to turn out in greater numbers.
One way to demonstrate how Lamb’s winning coalition differed from those of other Democrats in Pennsylvania is to compare his results to those of Eugene DePasquale, the Democratic state Auditor. In DePasquale’s re-election in 2016, he performed very similarly (less than half a percent difference) to Lamb in PA-18. However, a comparison of the two shows that they used very different electoral coalitions.
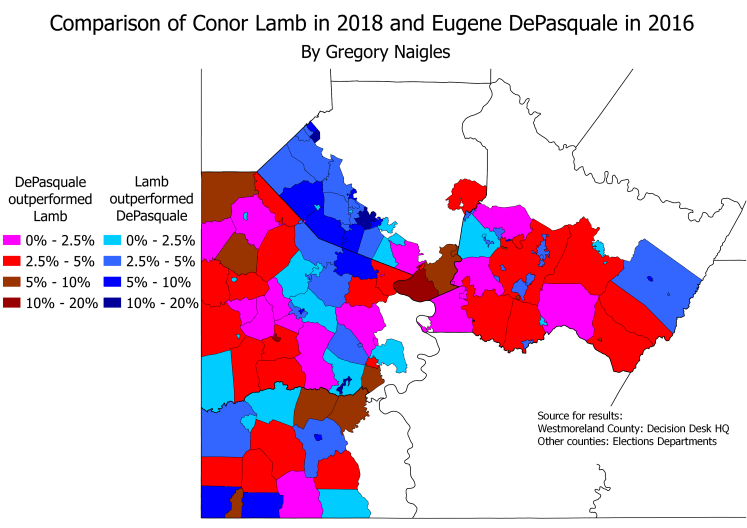
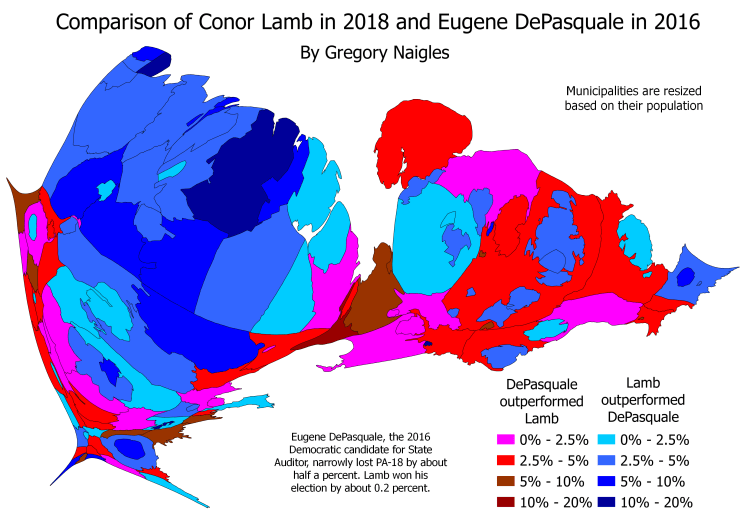
As both the map and the cartogram clearly show, Lamb substantially outperformed DePasquale in most of the Allegheny County suburbs in the district (basically all except those in Rick Saccone’s state House district). The towns there where he outperformed DePasquale the most are also the most well-educated towns in that area, and is a further data point to show that well-educated suburbs are swinging Democratic – in many cases even further than they swung in 2016. Lamb also outperformed DePasquale in the suburban townships in Washington County (which neither Lamb nor DePasquale won, but that Lamb lost by a smaller margin), and in the college town of Greensburg in Westmoreland County.
DePasquale, by contrast, used a more traditional Democratic coalition in his victory, with more emphasis on working-class whites and rural voters, and less reliance on upper-class suburbanites. This is shown by the fact that DePasquale substantially outperformed Lamb in most of rural Washington and Westmoreland counties (Greene County is an exception, probably due to low turnout there). Emphasizing a point that I made earlier, it is worth noting that Lamb ran roughly even with DePasquale in the middle-ring Pittsburgh suburbs in Westmoreland County – places like North Huntingdon and Penn townships. Those are the suburbs that also saw high turnout but still voted heavily Republican, due to their lesser levels of educational achievement – this was the main factor preventing Lamb from outperforming DePasquale there. As we saw from the 2016 elections, there are a lot more suburbs like this across the country than most people realized, and Democrats should not expect those suburbs to behave the same way as places like Mt. Lebanon.
To wrap up, I go back to my previous article about PA-18, where I said that Lamb had about a 25 percent chance of victory. In that article, I wrote that Lamb’s path to victory was as follows:
1) Match Torsella’s performance in the rural areas and working-class towns
2) Match Clinton’s performance in the well-educated suburbs
3) Have high Democratic turnout in the most Democratic areas of the district
How did these benchmarks hold up when looking at how Lamb actually performed in the election?
1) Match Torsella’s performance in the rural areas and working-class towns
Lamb succeeded in this. When looking at the overall election results in the rural areas and working-class towns of PA-18, Lamb’s performance was pretty close to Torsella’s.
2) Match Clinton’s performance in the well-educated suburbs
Lamb actually overachieved here – he outperformed Hillary Clinton everywhere, including in the well-educated suburbs.
3) Have high Democratic turnout in the most Democratic areas of the district
Lamb somewhat succeeded here. Democratic turnout in the most Democratic areas of the district (i.e. Mount Lebanon and the nearby inner suburbs of Pittsburgh) was quite high. However, this advantage was somewhat canceled out by the fact that turnout in the heavily-Republican Westmoreland County suburbs was also high. Therefore, turnout didn’t have as much of an impact on the results as it would’ve had to for Lamb to get full credit on this one.
Thus, in sum, Lamb succeeded in benchmark #1, overachieved in benchmark #2, and underachieved in benchmark #3. And that was enough for Lamb to pull off a very narrow victory.
