While most of the election-related headlines in Massachusetts last year concerned its gubernatorial race, Massachusetts also held elections last year for its four Constitutional Offices: Attorney General, Secretary of the Commonwealth, Treasurer, and Auditor. The elections for Secretary of the Commonwealth and Auditor saw Democratic incumbents running for re-election, while the elections for Attorney General and Treasurer saw open-seat races.
Ultimately, the Democrats won all four of these elections by solid margins. The closest of these four elections was for Treasurer, where Democrat Deborah Goldberg defeated Republican Michael James Heffernan 55-41, with a Green candidate taking the remaining 4 percent. Next closest was the Auditor election, where Democratic incumbent Suzanne Bump defeated Republican Patricia Saint Aubin by a 58-38 margin, again with a Green taking 4 percent. The Attorney General election saw Democrat Maura Healey defeat Republican John Miller by a 62-38 margin, with no third-party candidates on the ballot. Finally, in the election for Secretary of the Commonwealth, longtime Democratic incumbent William Galvin led the Democratic ticket by defeating Republican David D’arcangelo 67-29, with the remaining 4 percent going to a Green.
Galvin lost only two towns: Granville and Tolland, which border each other and are located west of Springfield. They also both border Hartland, Connecticut, one of the reddest towns in Connecticut. On the flip side, the map of Goldberg’s victory looks similar to those of some of the recent elections where Republicans did well, such as Scott Brown’s elections and Charlie Baker’s 2014 victory, however Goldberg won by losing many of Massachusetts’ suburbs and rural areas only narrowly, compared to Martha Coakley’s blowout losses there in the 2010 Senate and 2014 Gubernatorial elections.
I have averaged the results of these four races for each town and precinct in order to get a better look at where Democrats in general performed strongly, or more weakly, in 2014. The statewide average of these four races is 60-36 Democratic. I then compare these averages to Obama’s 2012 performance and to Charlie Baker’s 2014 performance to get an idea of where Obama and Baker may have overperformed and underperformed in their own elections. Finally, I take a look at the Green candidates’ results to see where they did the best, and where they barely registered.
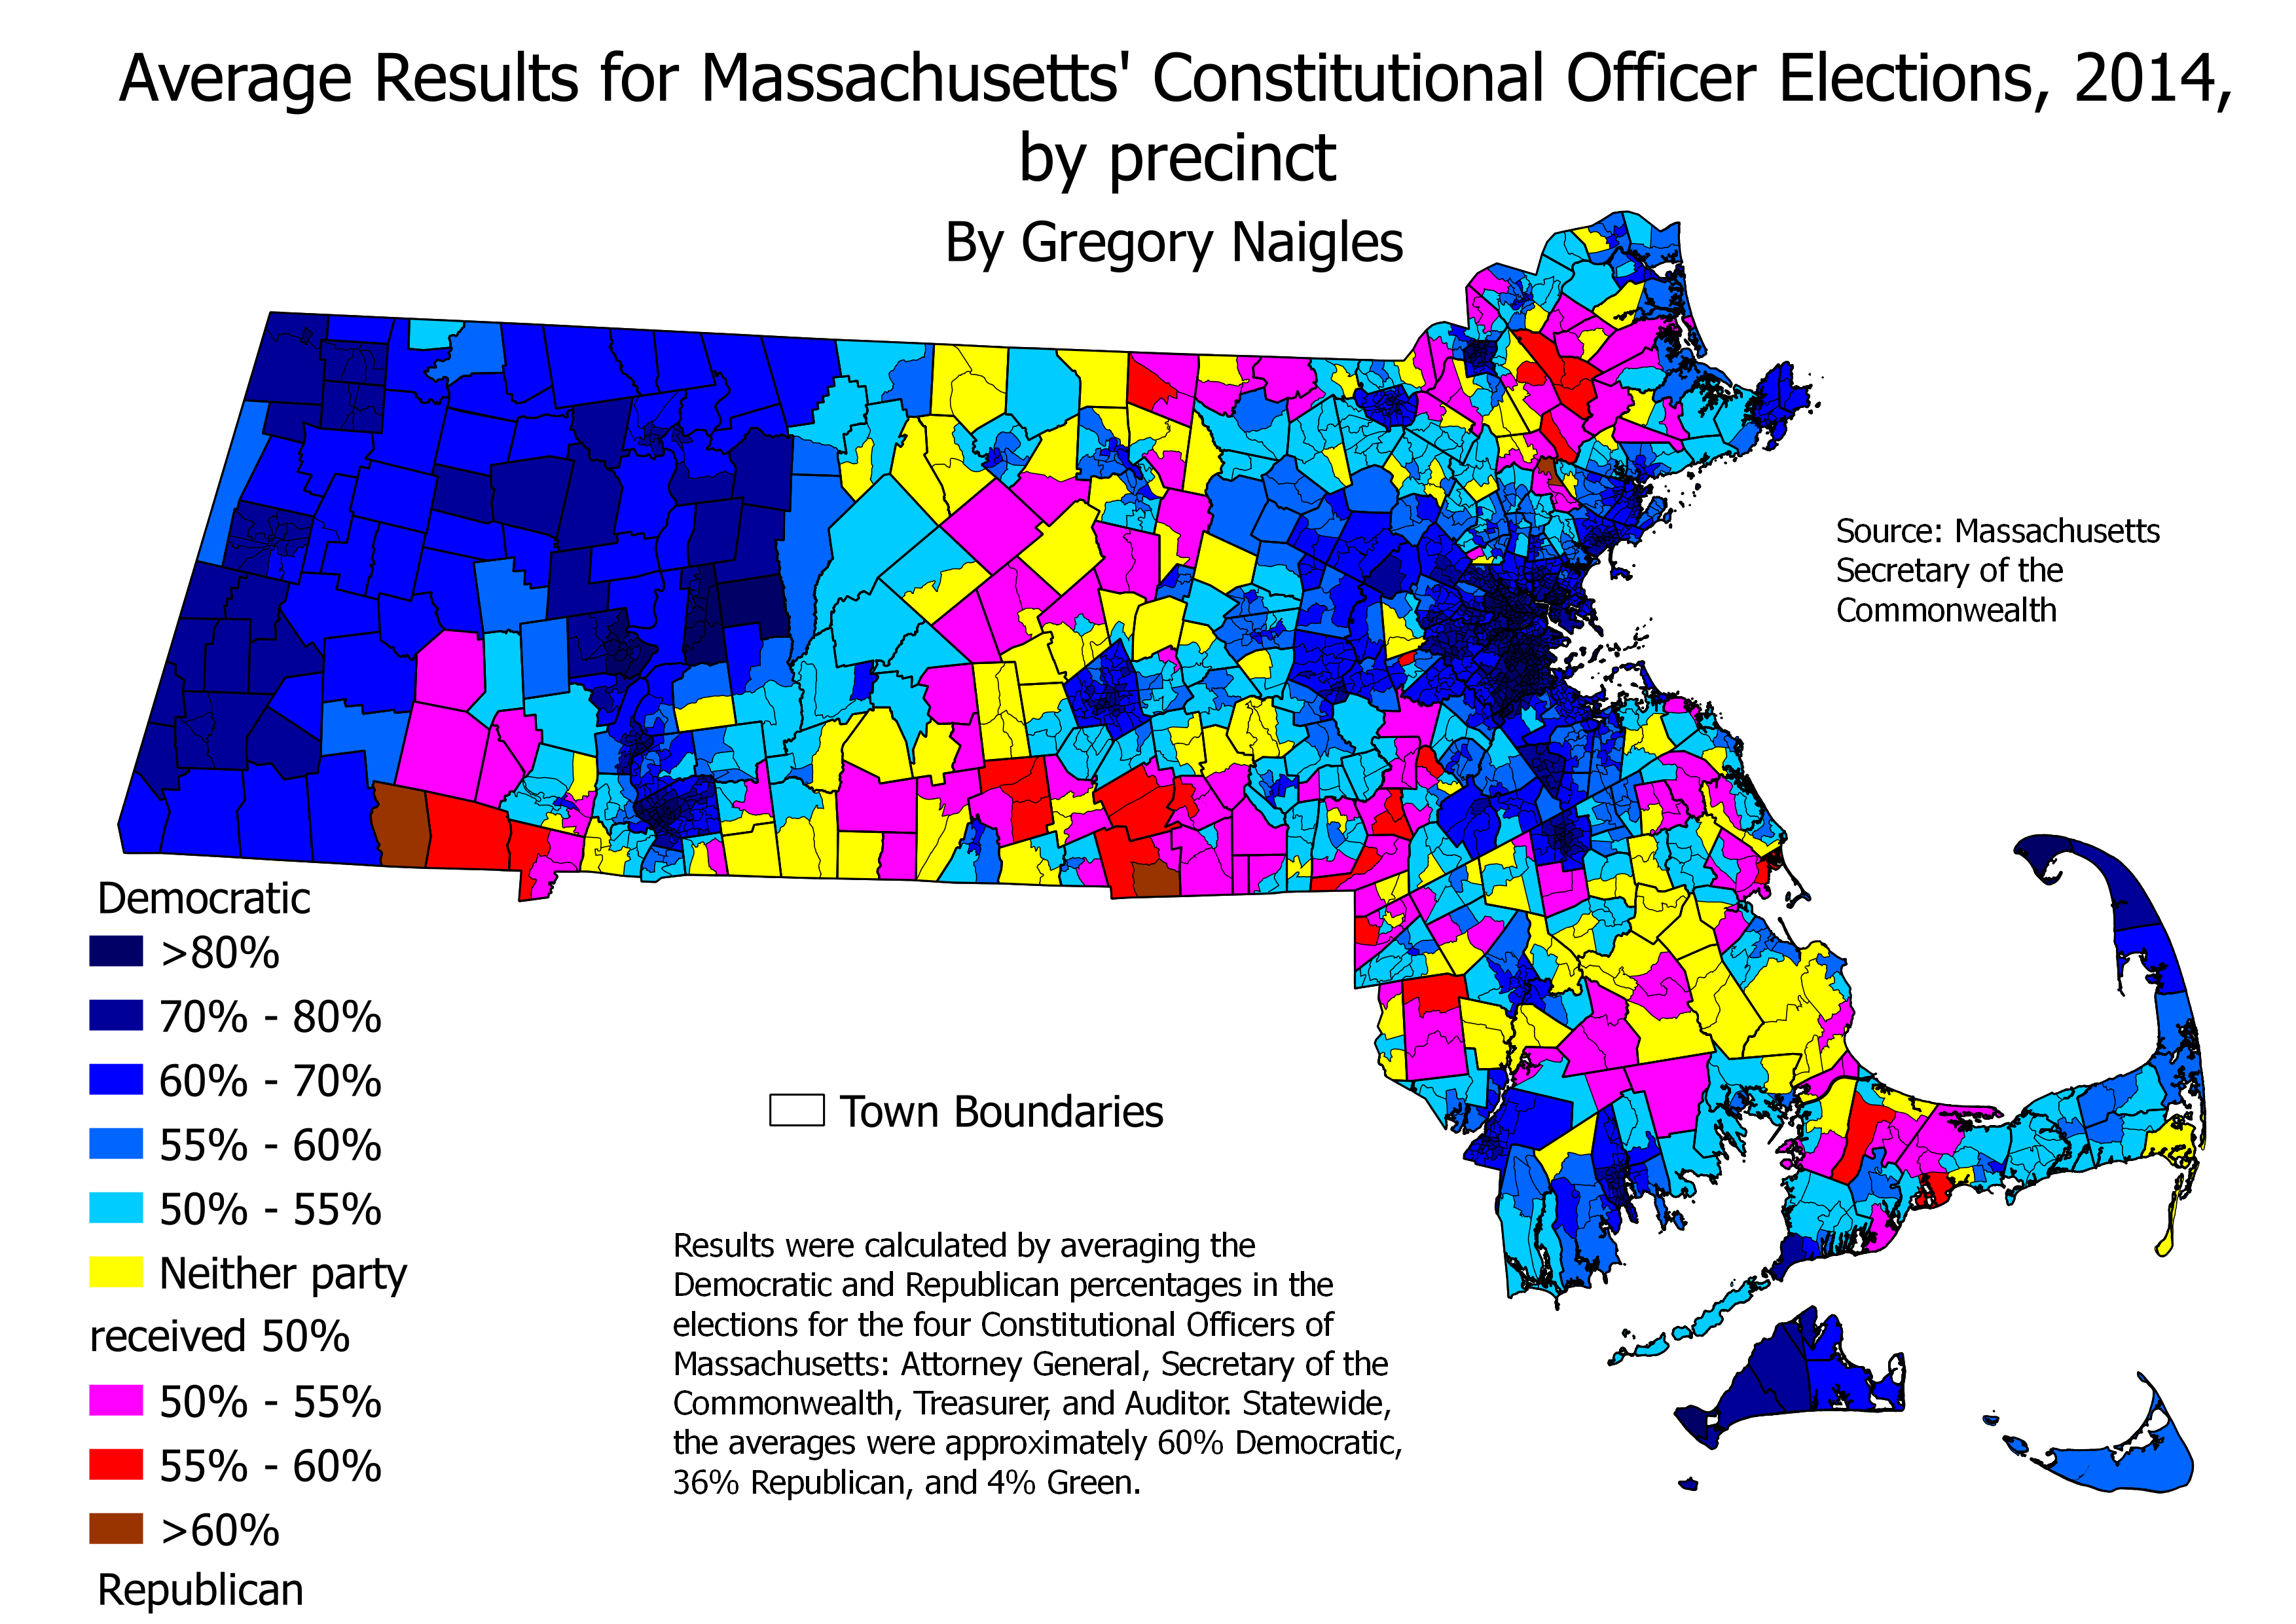
The map above shows the average results for the four Constitutional Officer elections in 2014. At first glance, it looks like a pretty run-of-the-mill Massachusetts map, however there are several interesting differences between this map and that of Obama’s 2012 performance. The map below compares the 2014 Democratic average with Obama’s 2012 performance. Blue precincts indicate that Obama outperformed the 2014 average, while red precincts indicate that the 2014 average outperformed Obama.
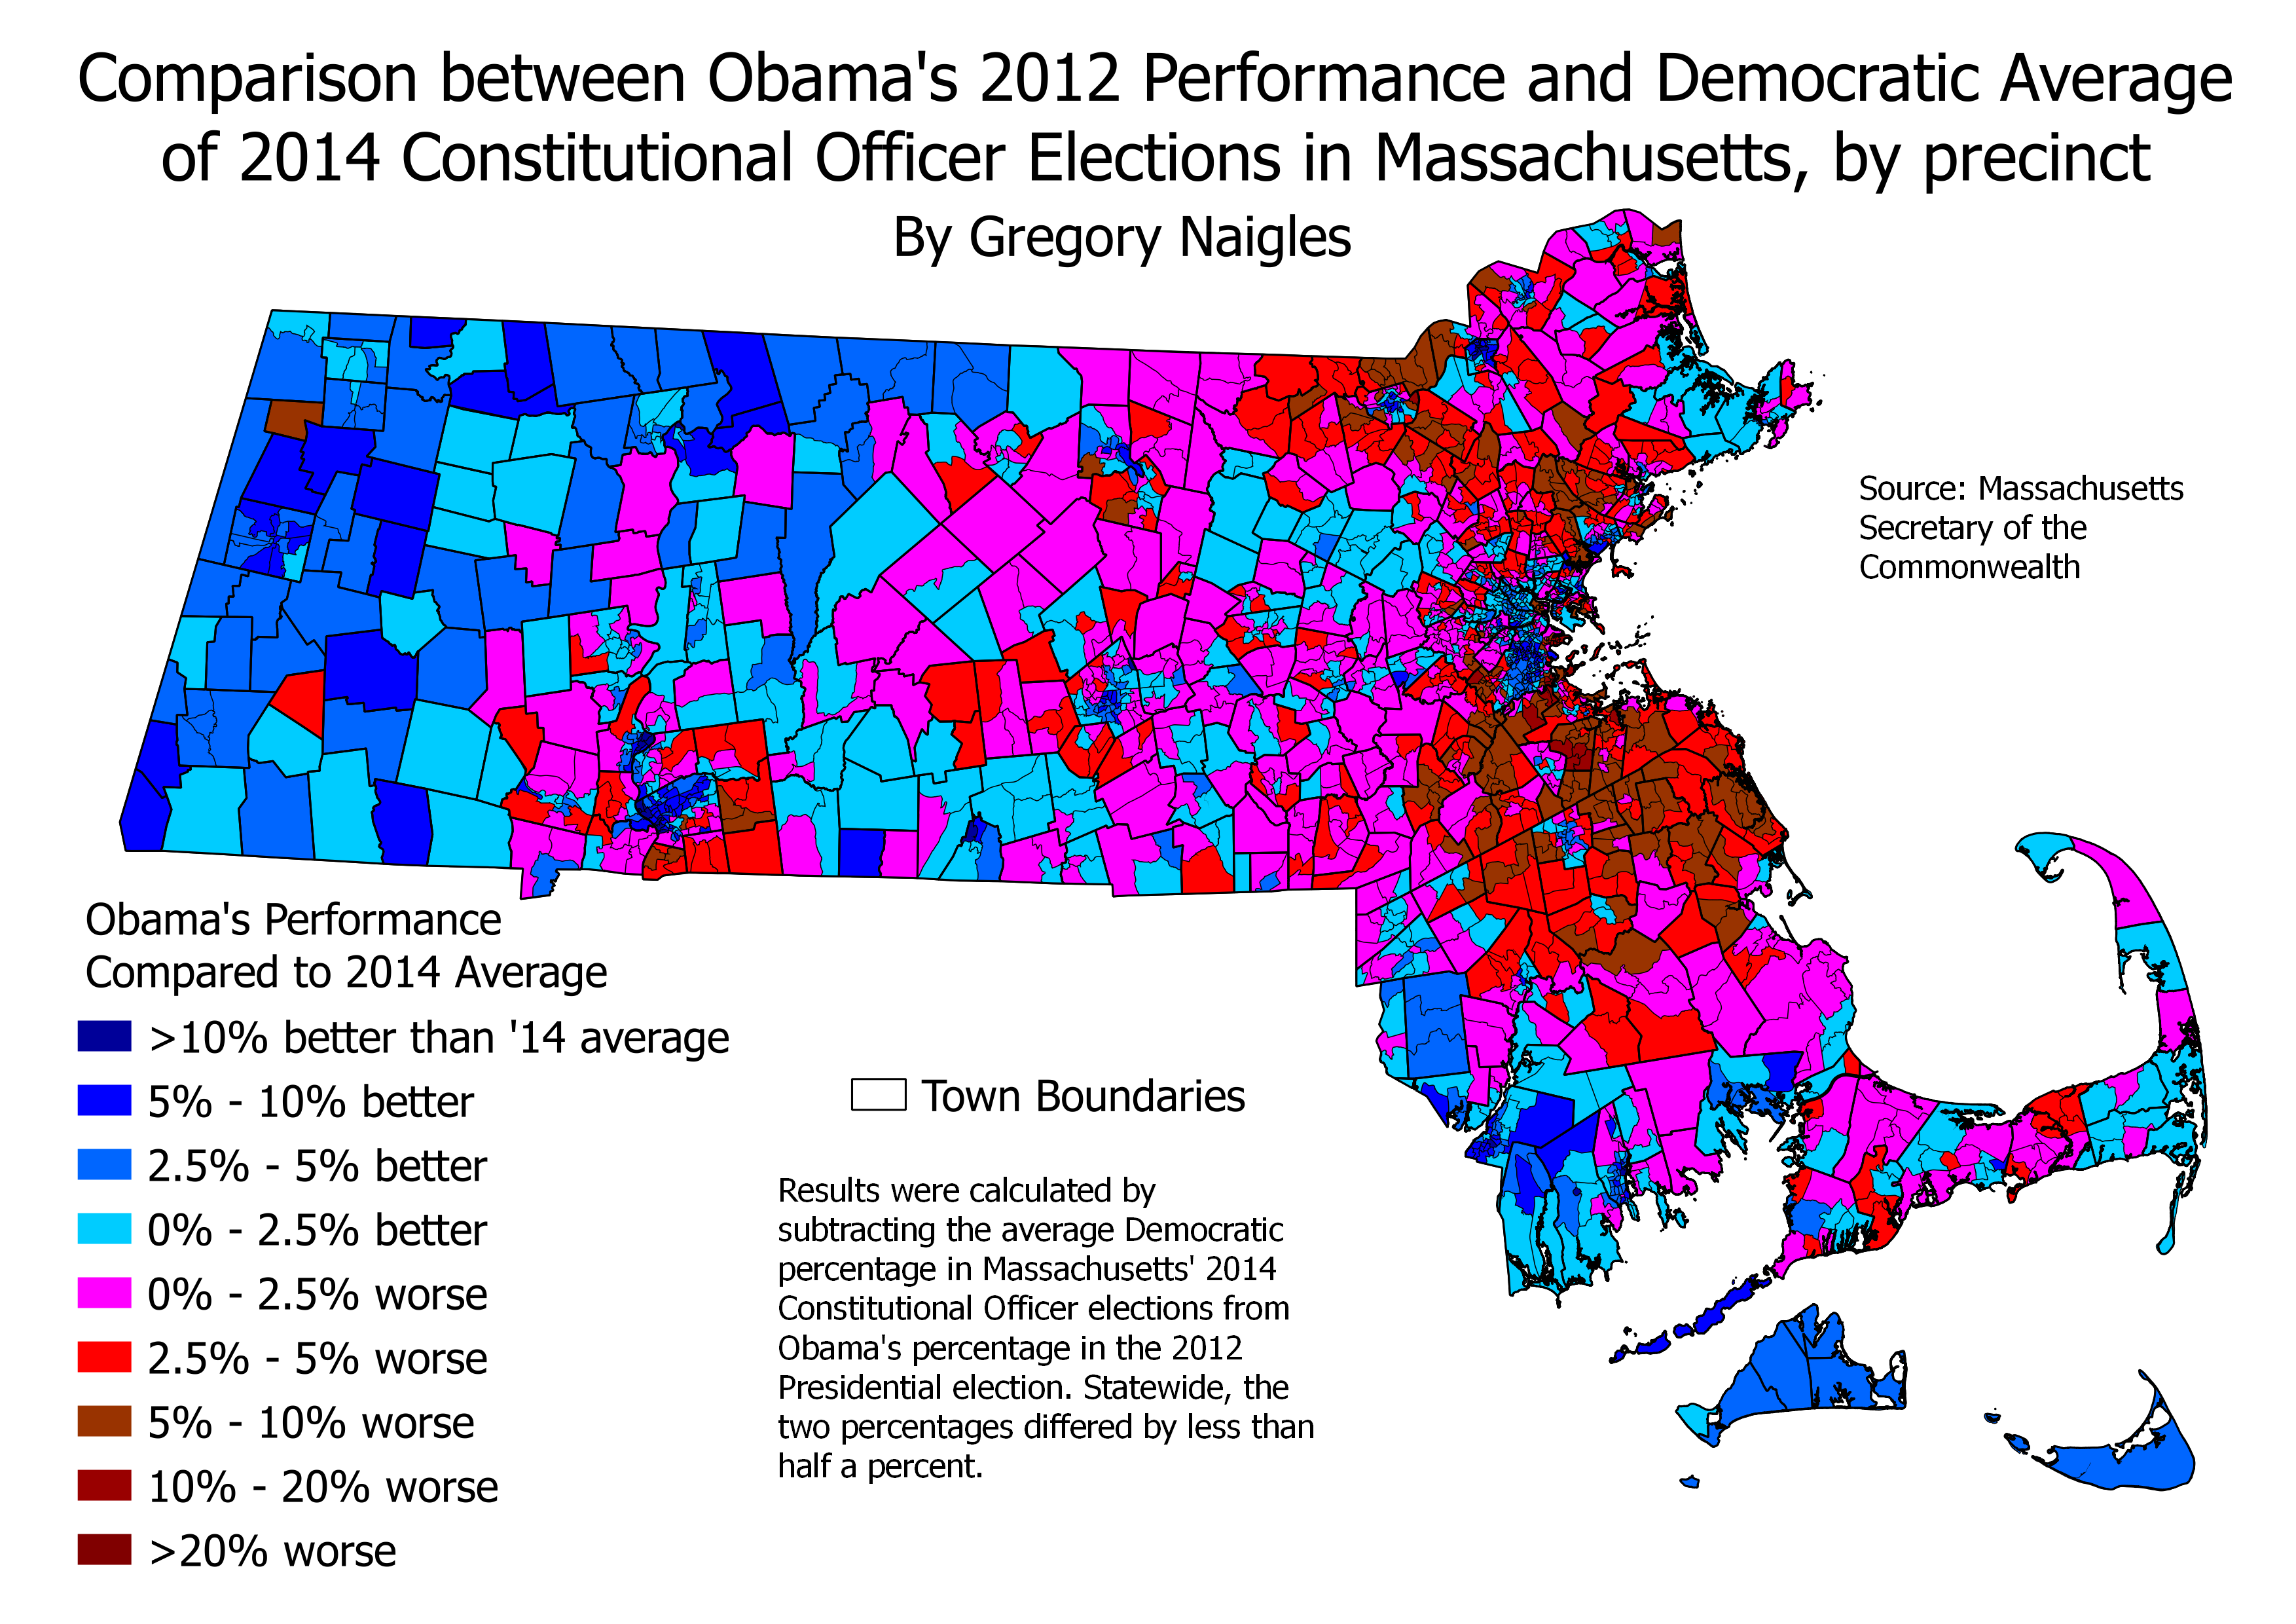
The first pattern that is immediately apparent is that Democrats in 2014 significantly outperformed Obama’s 2012 performance in most of the northern and southern suburbs of Boston. This overperformance was particularly strong in some of the inner southern suburbs, such as Milton, Braintree, and Weymouth. And this pattern isn’t just limited to the suburbs; a closer look at Boston will reveal that some of its neighborhoods, such as South Boston and West Roxbury, also saw Democrats in 2014 significantly outperform Obama.
What do these areas all have in common? They are all filled with working-class and lower-middle-class white people, the sort of people who used to be referred to as the “ethnic vote”. These areas, many of which have large Irish-American populations, used to be a major part of the Democratic coalition in Massachusetts. However, these areas have trended away from Democrats as Democrats increasingly became associated with highly-educated social liberals and with minorities. However, as the 2014 elections showed, the right Democrats can still win these areas, even during Republican waves.
And where did Obama outperform the 2014 Democratic average? With many of the highly-educated social liberals and minorities that I just mentioned. However, interestingly, he barely overperformed at all with highly-educated liberals who live in suburbs. As the map shows, he overperformed much more with rural liberals, particularly the ones in Western Massachusetts, and with urban liberals in places like Cambridge, Somerville, and Boston neighborhoods like Jamaica Plain. Obama also overperformed dramatically among racial minorities almost everywhere in the state, including Springfield, Holyoke, downtown Worcester, Lawrence, and the Boston neighborhoods of Dorchester and Mattapan. As it happens, those groups where Obama overperformed the Democratic average, including rural and urban liberals and racial minorities, also constituted Obama’s base back in the 2008 primaries, and the above map bears some similarity to the Obama/Clinton map in that primary. Since Clinton is likely to lead the Democratic ticket in 2016, it is possible that she will do better in the areas where Obama underperformed the 2014 average.
This next map compares the Republican average in the 2014 Constitutional Officer elections with Charlie Baker’s performance in the gubernatorial election. Since Baker significantly outperformed the Republican average almost everywhere, the red precincts on the map are where Baker outperformed the average by over 10 percent, while blue precincts represent places where Baker outperformed the average by less than 10 percent. Only in the precincts colored in the darkest shade of blue did Baker underperform the 2014 Republican average.
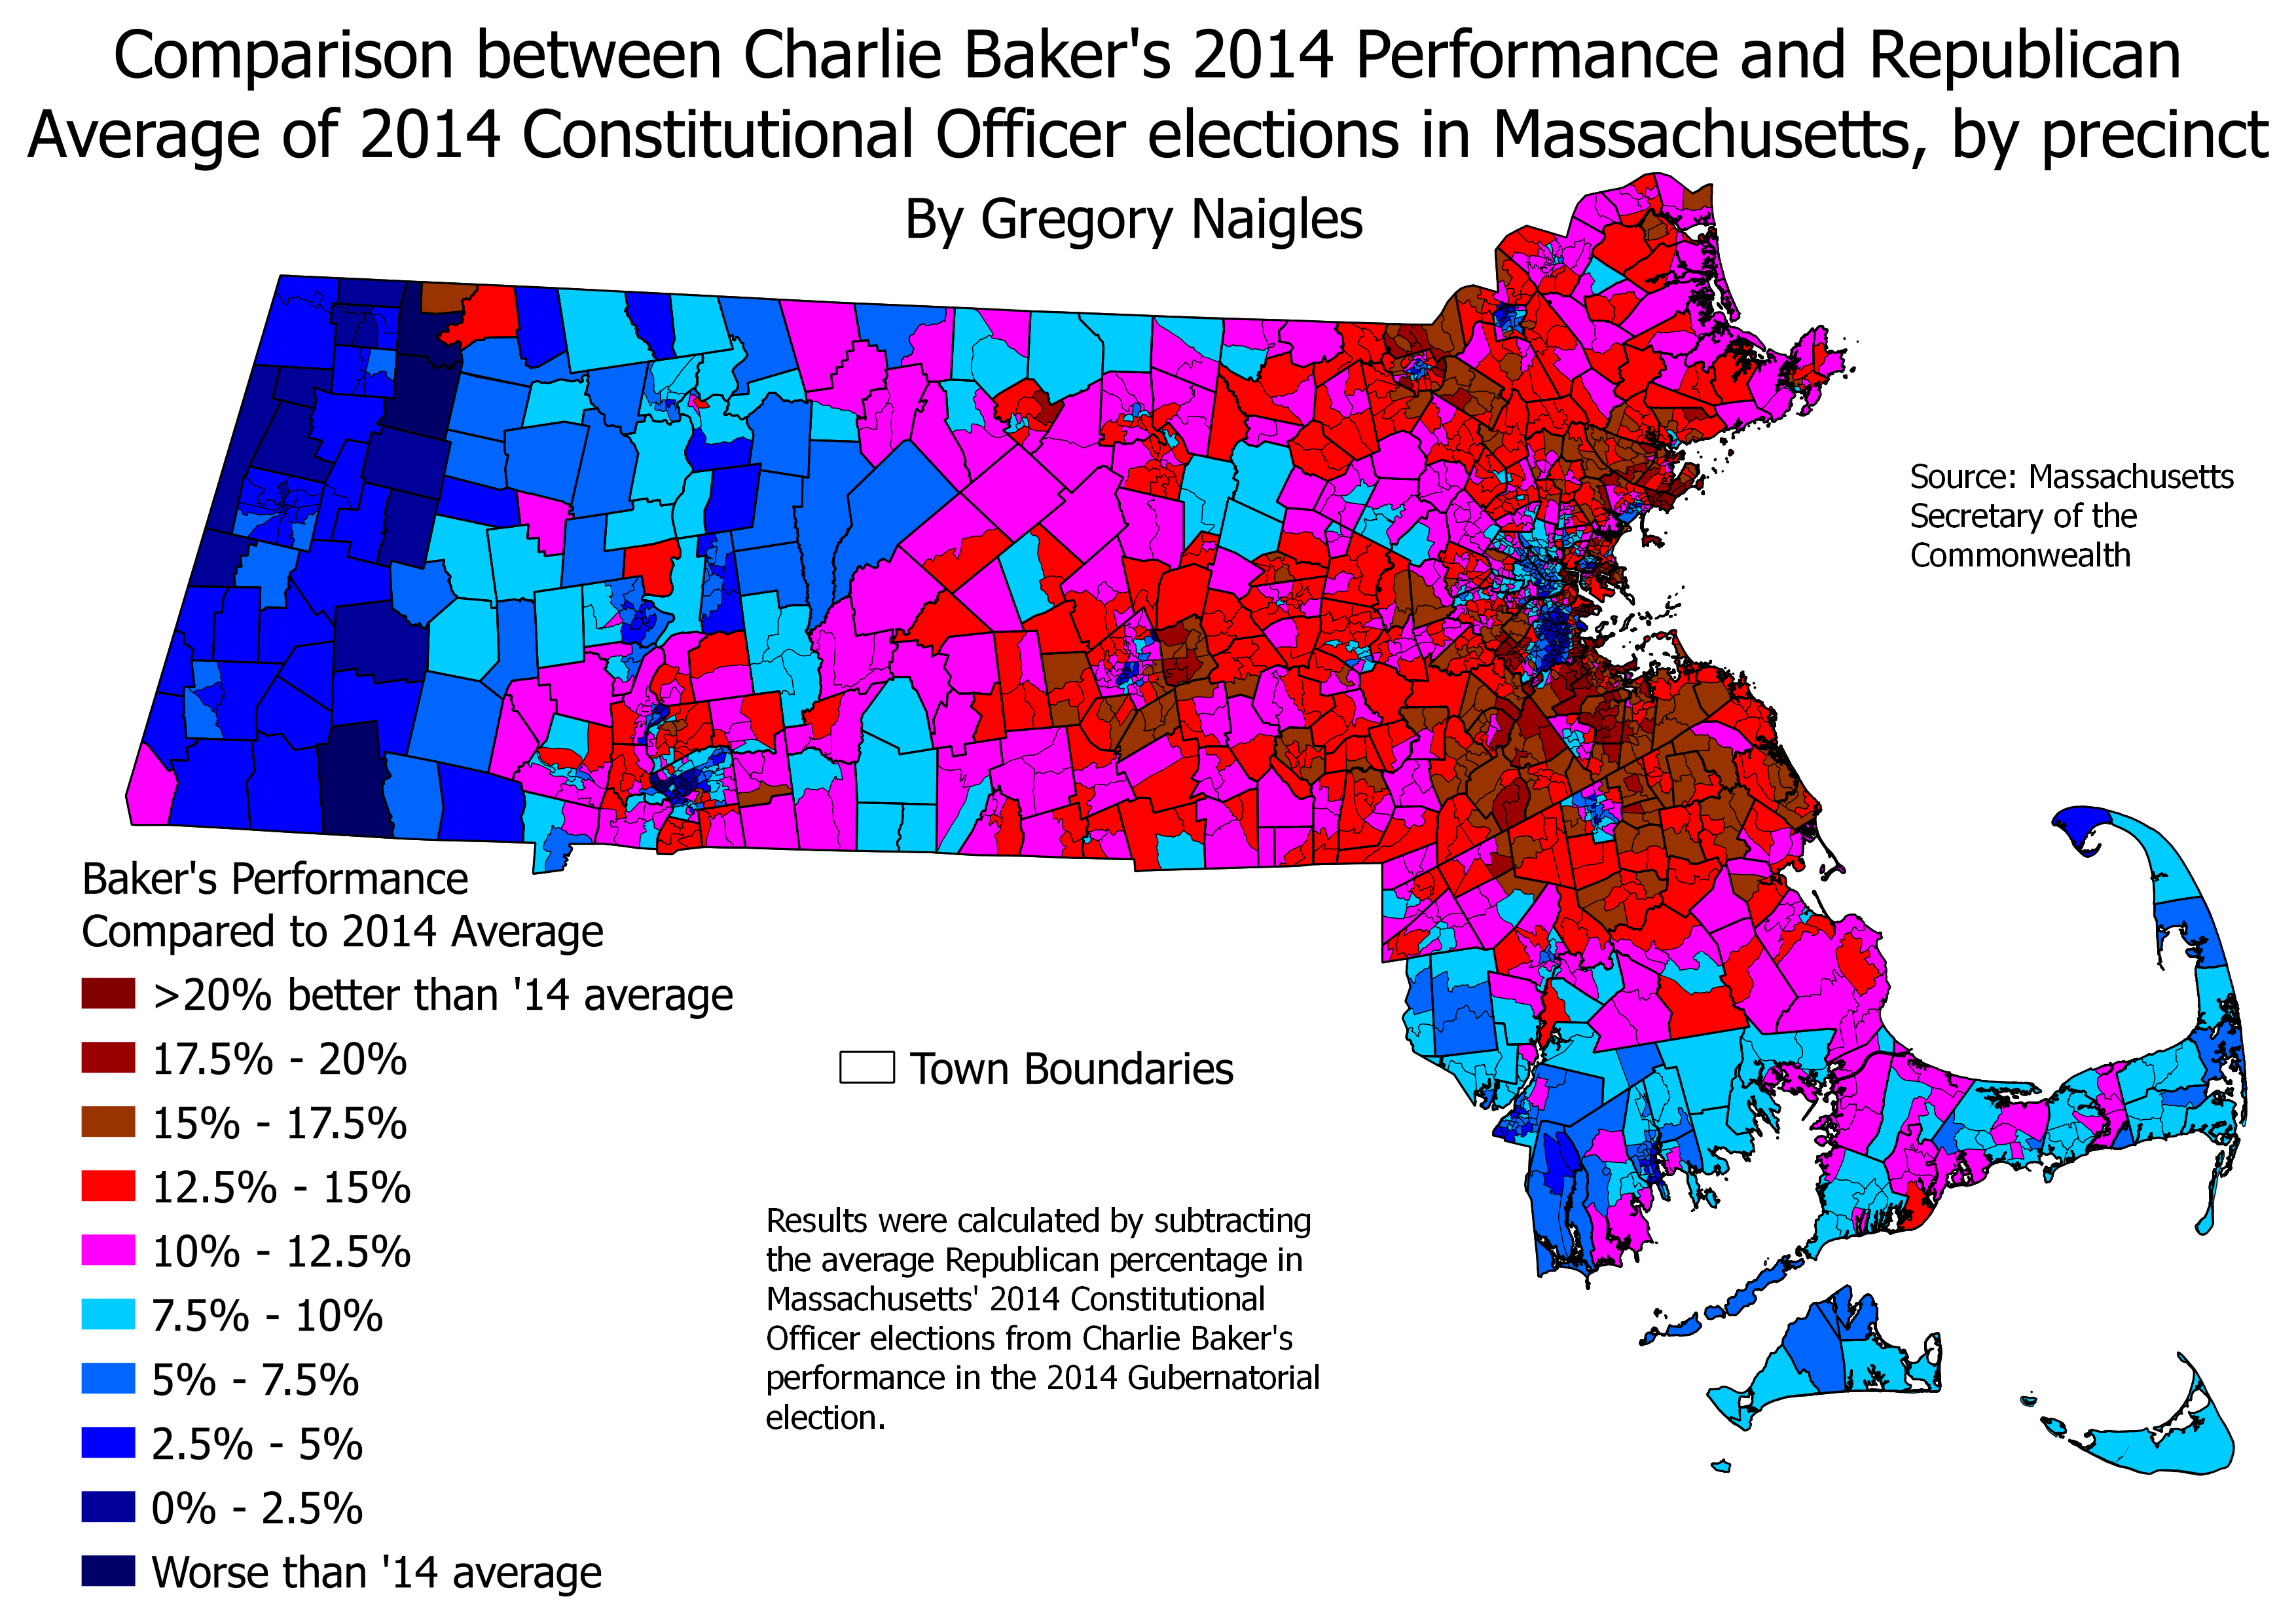
This map looks superficially similar to the previous one, but what this map really shows is how many people who voted Democratic in the Constitutional Officer elections were willing to split their tickets and vote for Charlie Baker as well. While the places where Obama underperformed the 2014 Democratic average were certainly very willing to split their tickets, the map also shows that there was a lot more ticket-splitting in the suburbs of Springfield and Worcester. There was less ticket-splitting in the richer suburbs of Boston, and in the whiter areas of Massachusetts’s cities, but there was still a considerable amount. It seems that the only people in Massachusetts who resolutely refuse to split their tickets are urban minorities, liberal whites in Cambridge and Somerville as well as in college towns, and those who live in the Berkshires. In addition, the impact of parochialism can also be seen on this map. One of the towns that changed the most from the previous map to this one was the town of Shrewsbury, just east of Worcester. Obama’s performance was about in line with the 2014 Democratic average there, however Baker massively outperformed the Republican average there. The reason for this is that Baker’s running mate, Karyn Polito, served as state representative for Shrewsbury for a decade. Baker also massively overperformed in his hometown of Swampscott, just east of Lynn. All six precincts there are colored in the darkest shade of red on the map.
Finally, I’ve also taken a look at where the Green candidates did the best in the three Constitutional Officer elections that they contested. The map below shows their average percentage in each precinct in Massachusetts.

As the map shows, the Green candidates generally did the worst in the same working-class and lower-middle-class places where Obama underperformed the 2014 Democratic average. The Greens also seemed to do well in places where Obama outperformed the 2014 Democratic average, and where Baker only barely outperformed the 2014 Republican average. However, there are some notable exceptions to this pattern. While the Green candidates did very well in the central Berkshires and the nearby college towns of Northampton and Amherst, they didn’t do quite so well in Berkshire County (though they did do better in Berkshire County than in the state as a whole). In addition, while the Green candidates did very well in Cambridge and Somerville, as well as the neighborhoods of Allston and Jamaica Plain in Boston, they did much less well in the minority-dominated areas of Boston and of the other cities in the state. Also considering that the Green candidates did very well in the precinct of Dartmouth that contains UMass Dartmouth, but did only average in the rest of the town, I think it’s safe to say that Green candidates did particularly well with college students and other college-affiliated voters such as professors. However, the Greens’ failure to perform better than average among minority voters shows that their message is more tailored toward white liberals, and that minorities are sticking with Democrats. In fact, I wouldn’t be surprised if the results of the 2016 Democratic primary between Hillary Clinton and Bernie Sanders resemble this map. Bernie will do well in the Berkshires, in college towns, and among white urban liberals, while Hillary will win everywhere else.
