[Updated February 2019]
I have made dozens of maps of New York, New Jersey, and Pennsylvania. The system of municipal organization that these states use makes analysis of their election results particularly revealing. A couple examples are below (open the maps in a new tab to enlarge).


I have made maps of New York showing:
- 2008 and 2012 Presidential results by municipality, and comparisons between the two
- 2008 and 2012 Presidential election turnout, both by comparison between the two and as a percentage of the voting age population (VAP)
- 2012 Presidential results as a cartogram, with municipalities resized based on their population as of the 2010 Census
- 2018 NY-22 results, and comparisons to the 2012 and 2016 presidential elections
I have made maps of New Jersey showing:
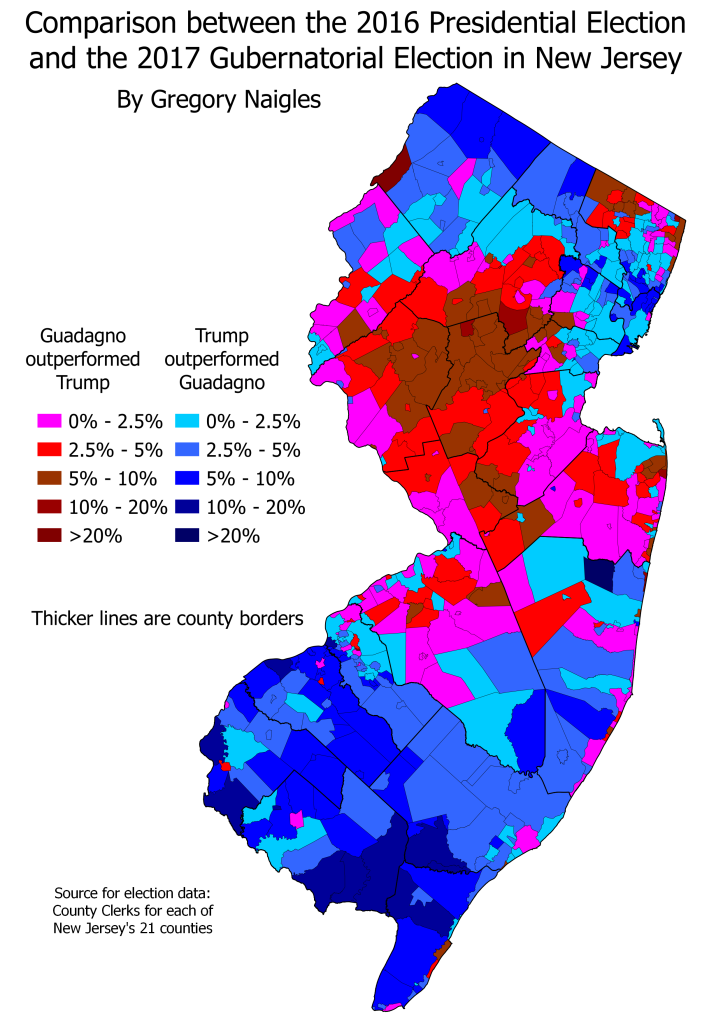
- 2008, 2012, and 2016 Presidential results by municipality, and comparisons between them
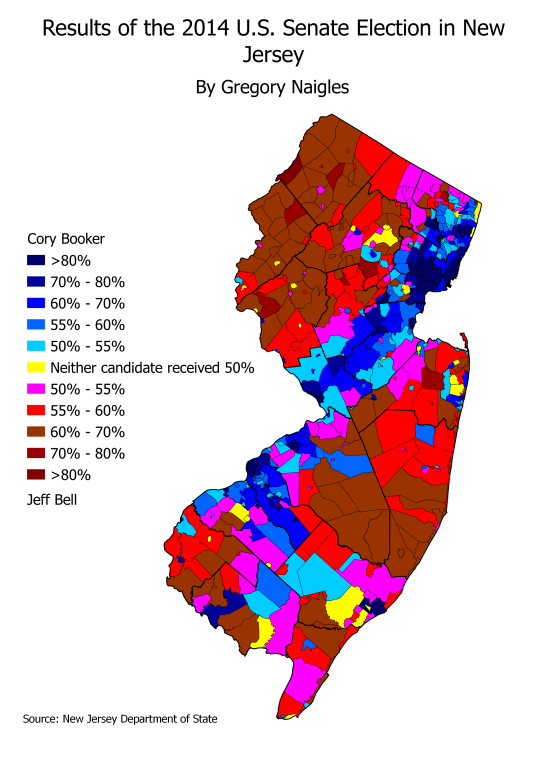
- 2012, 2013, 2014, and 2018 U.S. Senate results, and comparisons between them
- 2018 Congressional results, and comparisons to previous elections
- 2009, 2013, and 2017 gubernatorial results
- 2017 State Senate and State Assembly results, and comparisons to previous elections
- 2014 Bergen County Executive results, and comparisons to 2014 Senate and 2012 Presidential elections
- Racial demographics by municipality as of the 2010 Census
I have made maps of Pennsylvania showing:
- 2008, 2012, and 2016 Presidential results by municipality, and comparisons between them
- 2008 and 2012 Presidential election turnout, both by comparison between the two and as a percentage of the voting age population (VAP)
- 2012 Presidential results as a cartogram, with municipalities resized based on their population as of the 2010 Census
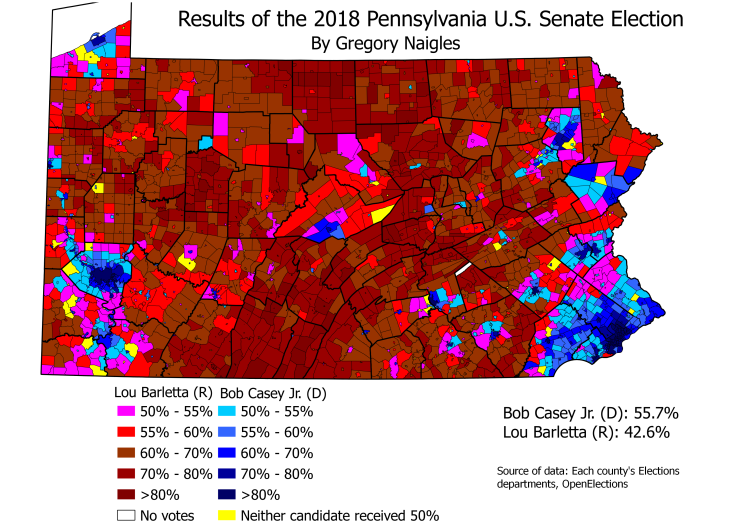
- 2018 U.S. Senate results by municipality, and comparisons to previous elections
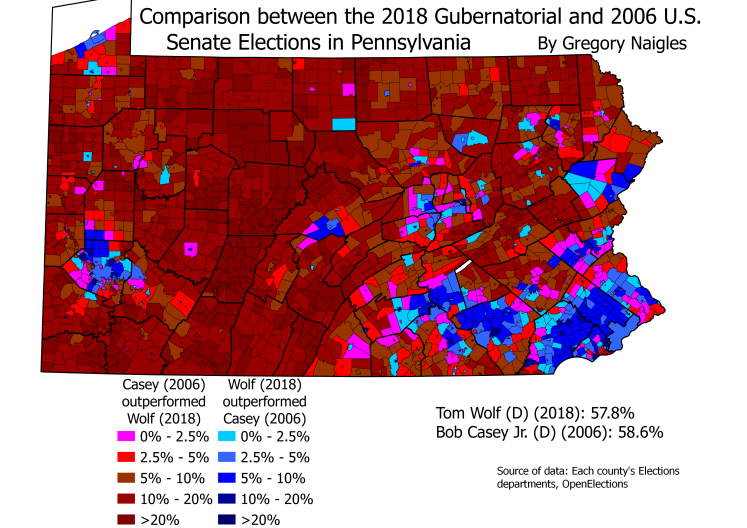
- 2018 Gubernatorial results by municipality, and comparisons to previous elections
- 2012 and 2014 Congressional results, and comparisons to Presidential (2012) and Gubernatorial (2014) results
- 2018 PA-10 and PA-11 results, and PA-18 special election results
- 2012 and 2014 State Senate results, and comparisons to Presidential (2012) and Gubernatorial (2014) results
- 2012 and 2014 State House results, and comparisons to Presidential (2012) and gubernatorial (2014) results

Thanks for this excellent work! Any chance you could produce a cartogram of NJ?
LikeLike
Sure! Is there a particular election that you’d like to see a cartogram of?
LikeLike